

The transcriptionally active amyloid precursor protein (APP) intracellular domain is preferentially produced from the 695 isoform of APP in a {beta}-secretase-dependent pathway
- PMID: 20961856
- PMCID: PMC3009870
- DOI: 10.1074/jbc.M110.141390
The transcriptionally active amyloid precursor protein (APP) intracellular domain is preferentially produced from the 695 isoform of APP in a {beta}-secretase-dependent pathway
Abstract
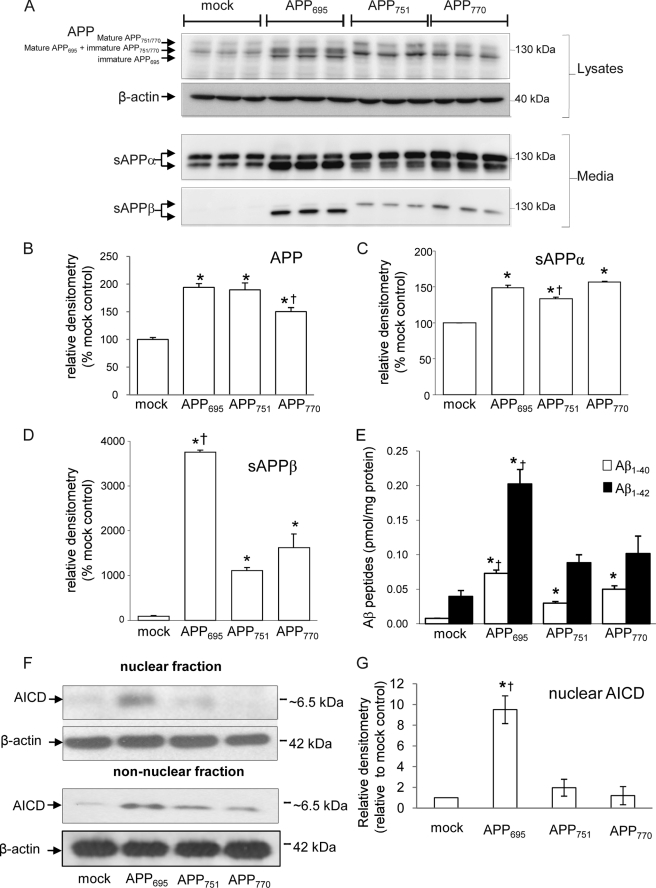
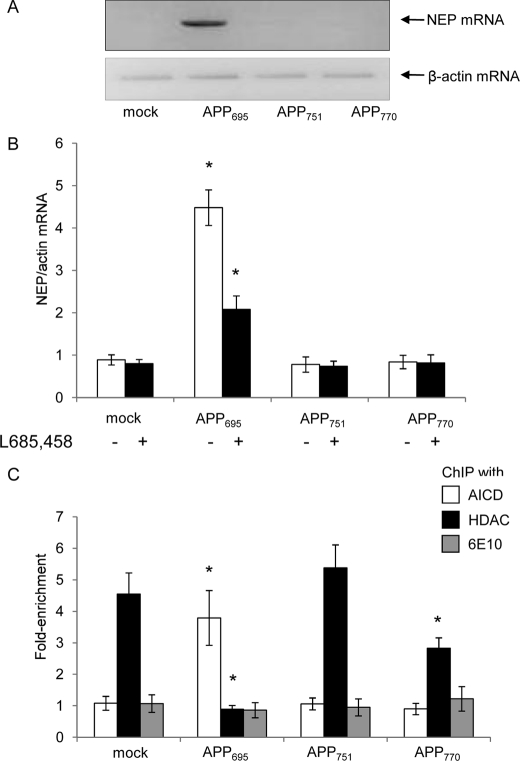
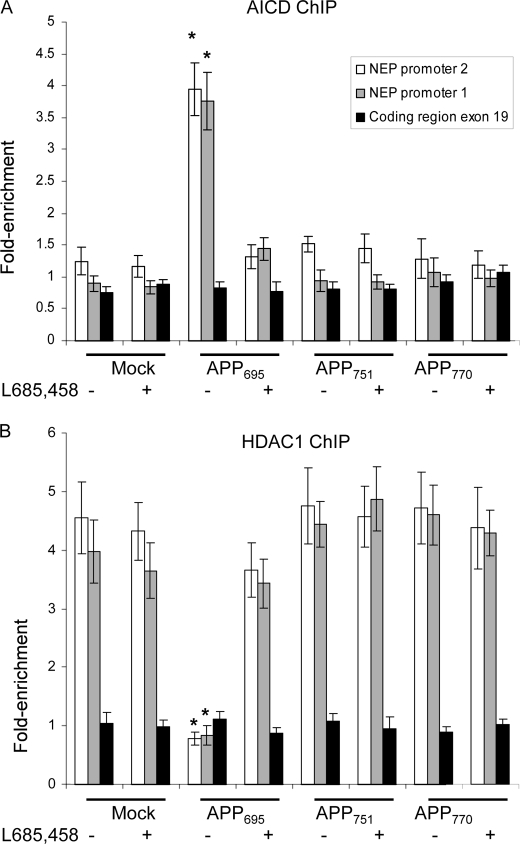
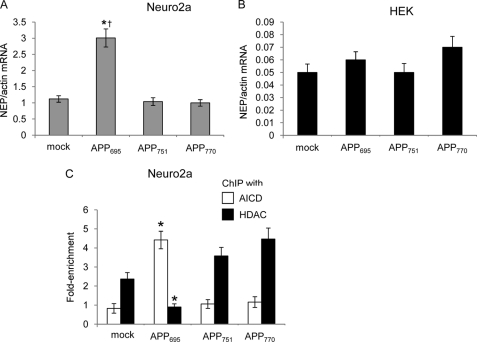
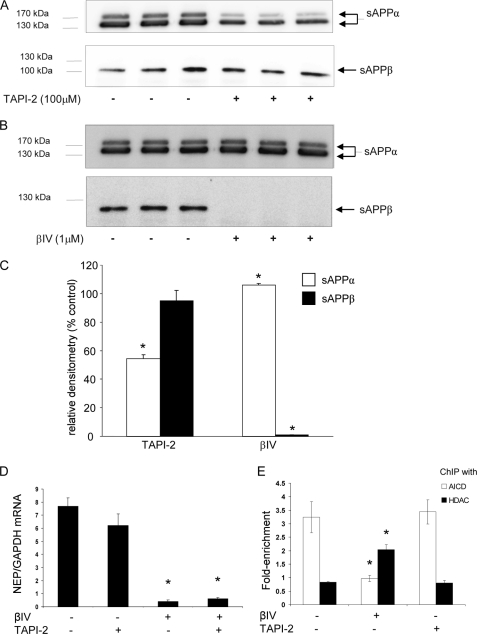
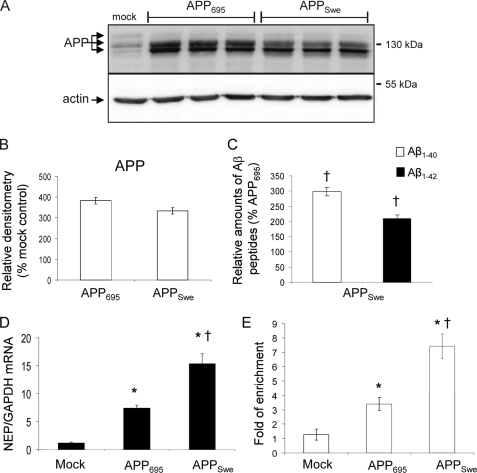
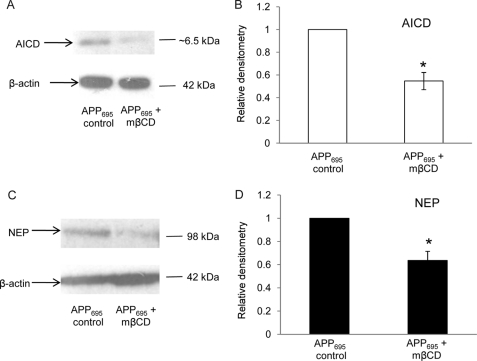
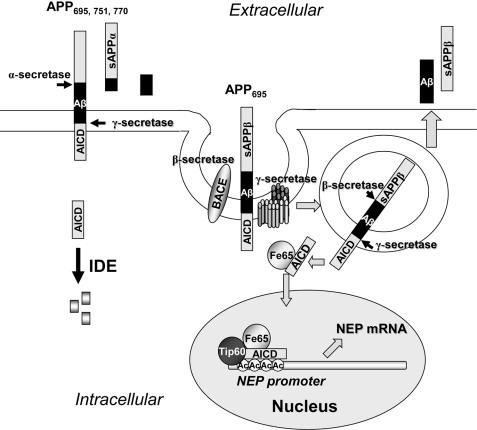
Amyloidogenic processing of the amyloid precursor protein (APP) by β- and γ-secretases generates several biologically active products, including amyloid-β (Aβ) and the APP intracellular domain (AICD). AICD regulates transcription of several neuronal genes, especially the Aβ-degrading enzyme, neprilysin (NEP). APP exists in several alternatively spliced isoforms, APP(695), APP(751), and APP(770). We have examined whether each isoform can contribute to AICD generation and hence up-regulation of NEP expression. Using SH-SY5Y neuronal cells stably expressing each of the APP isoforms, we observed that only APP(695) up-regulated nuclear AICD levels (9-fold) and NEP expression (6-fold). Increased NEP expression was abolished by a β- or γ-secretase inhibitor but not an α-secretase inhibitor. This correlated with a marked increase in both Aβ(1-40) and Aβ(1-42) in APP(695) cells as compared with APP(751) or APP(770) cells. Similar phenomena were observed in Neuro2a but not HEK293 cells. SH-SY5Y cells expressing the Swedish mutant of APP(695) also showed an increase in Aβ levels and NEP expression as compared with wild-type APP(695) cells. Chromatin immunoprecipitation revealed that AICD was associated with the NEP promoter in APP(695), Neuro2a, and APP(Swe) cells but not APP(751) nor APP(770) cells where AICD was replaced by histone deacetylase 1 (HDAC1). AICD occupancy of the NEP promoter was replaced by HDAC1 after treatment of the APP(695) cells with a β- but not an α-secretase inhibitor. The increased AICD and NEP levels were significantly reduced in cholesterol-depleted APP(695) cells. In conclusion, Aβ and functional AICD appear to be preferentially synthesized through β-secretase action on APP(695).
Figures
Similar articles
-
The Aβ-clearance protein transthyretin, like neprilysin, is epigenetically regulated by the amyloid precursor protein intracellular domain.J Neurochem. 2014 Aug;130(3):419-31. doi: 10.1111/jnc.12680. Epub 2014 Mar 12. J Neurochem. 2014. PMID: 24528201
-
The impact of amyloid precursor protein signalling and histone deacetylase inhibition on neprilysin expression in human prostate cells.Int J Cancer. 2012 Feb 15;130(4):775-86. doi: 10.1002/ijc.26028. Epub 2011 Jun 18. Int J Cancer. 2012. PMID: 21365649
-
APP intracellular domain derived from amyloidogenic β- and γ-secretase cleavage regulates neprilysin expression.Front Aging Neurosci. 2015 May 19;7:77. doi: 10.3389/fnagi.2015.00077. eCollection 2015. Front Aging Neurosci. 2015. PMID: 26074811 Free PMC article.
-
AICD nuclear signaling and its possible contribution to Alzheimer's disease.Curr Alzheimer Res. 2012 Feb;9(2):200-16. doi: 10.2174/156720512799361673. Curr Alzheimer Res. 2012. PMID: 21605035 Review.
-
The amyloid precursor protein: a biochemical enigma in brain development, function and disease.FEBS Lett. 2013 Jun 27;587(13):2046-54. doi: 10.1016/j.febslet.2013.05.010. Epub 2013 May 16. FEBS Lett. 2013. PMID: 23684647 Review.
Cited by
-
The Alzheimer's amyloid-degrading peptidase, neprilysin: can we control it?Int J Alzheimers Dis. 2012;2012:383796. doi: 10.1155/2012/383796. Epub 2012 Jul 26. Int J Alzheimers Dis. 2012. PMID: 22900228 Free PMC article.
-
Melatonin Induction of APP Intracellular Domain 50 SUMOylation Alleviates AD through Enhanced Transcriptional Activation and Aβ Degradation.Mol Ther. 2021 Jan 6;29(1):376-395. doi: 10.1016/j.ymthe.2020.09.003. Epub 2020 Sep 5. Mol Ther. 2021. PMID: 32950104 Free PMC article.
-
Amyloid Precursor Protein (APP) Controls the Expression of the Transcriptional Activator Neuronal PAS Domain Protein 4 (NPAS4) and Synaptic GABA Release.eNeuro. 2020 May 28;7(3):ENEURO.0322-19.2020. doi: 10.1523/ENEURO.0322-19.2020. Print 2020 May/Jun. eNeuro. 2020. PMID: 32327470 Free PMC article.
-
Multiple mechanisms of iron-induced amyloid beta-peptide accumulation in SHSY5Y cells: protective action of negletein.Neuromolecular Med. 2014 Dec;16(4):787-98. doi: 10.1007/s12017-014-8328-4. Epub 2014 Sep 24. Neuromolecular Med. 2014. PMID: 25249289
-
Amyloid-clearing proteins and their epigenetic regulation as a therapeutic target in Alzheimer's disease.Front Aging Neurosci. 2014 Sep 17;6:235. doi: 10.3389/fnagi.2014.00235. eCollection 2014. Front Aging Neurosci. 2014. PMID: 25278875 Free PMC article. Review.
References
-
- Selkoe D. J. (1991) Neuron 6, 487–498 - PubMed
-
- Hardy J. A., Higgins G. A. (1992) Science 256, 184–185 - PubMed
-
- Nalivaeva N. N., Fisk L. R., Belyaev N. D., Turner A. J. (2008) Curr. Alzheimer Res. 5, 212–224 - PubMed
-
- Hersh L. B., Rodgers D. W. (2008) Curr. Alzheimer Res. 5, 225–231 - PubMed
-
- Sandbrink R., Masters C. L., Beyreuther K. (1996) Ann. N.Y. Acad. Sci. 777, 281–287 - PubMed
Publication types
MeSH terms
Substances
Grants and funding
LinkOut - more resources
Full Text Sources
Miscellaneous
