. 2010 Dec 31;285(53):41402-11.
doi: 10.1074/jbc.M110.155176. Epub 2010 Oct 20.

Cholesterol and lipid phases influence the interactions between serotonin receptor agonists and lipid bilayers

Affiliations

Cholesterol and lipid phases influence the interactions between serotonin receptor agonists and lipid bilayers

Rebecca Batchelor et al. J Biol Chem. .

Abstract

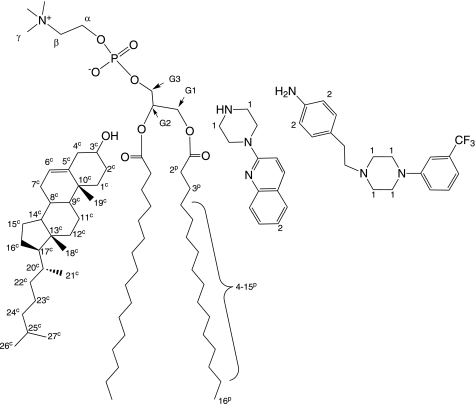
Solid state NMR techniques have been used to investigate the effect that two serotonin receptor 1a agonists (quipazine and LY-165,163) have on the phase behavior of, and interactions within, cholesterol/phosphocholine lipid bilayers. The presence of agonist, and particularly LY-165,163, appears to widen the phase transitions, an effect that is much more pronounced in the presence of cholesterol. It was found that both agonists locate close to the cholesterol, and their interactions with the lipids are modulated by the lipid phases. As the membrane condenses into mixed liquid-ordered/disordered phases, quipazine is pushed up toward the surface of the bilayer, whereas LY-165,163 moves deeper into the lipid chain region. In light of our results, we discuss the role of lipid/drug interactions on drug efficacy.


Figures

FIGURE 1.
FIGURE 1.
Structures (from left to right) of cholesterol, DPPC, quipazine, and LY-165,163. Resonance assignments refer to peaks labeled in Fig. 2. Superscript c denotes a cholesterol peak, and superscript p denotes a phospholipid peak.
FIGURE 2.
FIGURE 2.
1H MAS NMR spectra of DPPC/D2O dispersions doped with 20 mol % cholesterol and/or 10 mol % quipazine or LY-165,163. Spectra on the left were collected at 318 K, and spectra on the right were collected at 300 K. A, DPPC/D2O in the absence of cholesterol and agonist; B, DPPC-d62/D2O plus cholesterol (8:2 mole ratio) in the absence of agonist; C, DPPC-d62/D2O plus cholesterol and LY-165,163 (7:2:1 mole ratio); D, DPPC-d62/D2O plus cholesterol and quipazine (7:2:1 mole ratio). Assignments for the agonist, DPPC, and cholesterol signals are according to Lopez and Lorch (17), Scheidt et al. (14), and Soubias et al. (33), respectively, and correspond to labels on the molecules in Fig. 2. Superscript c denotes a cholesterol peak, and superscript p denotes a phospholipid peak. For DPPC, peaks are as follows: C16p (a), C4–15p (b), C3p (c), C2p (d), γp (e), βp (f), G3p (g); G1p (h), αp (i), HDO (j), and G2p (k). For cholesterol, peaks are as follows: C18c (l), C26/27c (m), C9/21/19c (n), C14/17/24c (o), C7/C8/C11/C15/C25c (p), and C4c (q).
FIGURE 3.
FIGURE 3.
2H NMR spectra of DPPC-d62/cholesterol/LY-165,163 (7:2:1 mole ratio) collected at the temperatures indicated. Inset, an expansion of the middle 20 kHz of each spectrum.
FIGURE 4.
FIGURE 4.
M1 on the left-hand axis of the 2H spectra versus temperature for DPPC-d62 (circles), DPPC-d62/quipazine (squares), and DPPC-d62/LY-165,163 (open triangles). Filled square, magnitude of the methyl peak splittings versus temperature for DPPC-d62/LY-165,163. Phospholipids are at a 9:1 mole ratio with the agonists.
FIGURE 5.
FIGURE 5.
M1 (left-hand axis, open symbols) of the 2H spectra and magnitude of methyl peak splittings (right-hand axis, closed symbols) versus temperature for DPPC-d62/cholesterol/quipazine (7:2:1 mole ratio) (A), DPPC-d62/cholesterol/LY-165,163 (7:2:1 mole ratio) (B), and DPPC-d62/cholesterol (8:2 mole ratio) (C). Also shown are phase transition boundaries for Lo (between the dotted lines) derived from the extent of the methyl peak splittings and the approximate gel/Ld boundaries (dashed lines) judged from the shape of the 1H and 2H spectra.
FIGURE 6.
FIGURE 6.
2H order parameter profiles, at 323 K, of the sn-1 chain of DPPC-d62 (open circles) plus quipazine (9:1 mole ratio) (open squares), LY-165,163 (9:1 mole ratio) (open triangles), cholesterol (8:2 mole ratio) (filled circles), cholesterol and quipazine (7:2:1 mole ratio) (filled squares), and cholesterol and LY-165,163 (7:2:1 mole ratio) (filled triangles). The sn-1 chain peaks were deconvoluted from the sn-2 signals in the 2H spectra based on the published assignments (28, 29).
FIGURE 7.
FIGURE 7.
1H MAS-NOESY spectrum of DPPC-d62 doped with cholesterol and LY-165,163 (7:2:1 mole ratio) collected at 300 K with 200 ms mixing time. The cholesterol signals can be seen between 0 and 2.5 ppm. The DPPC glycerol and headgroup signals appear between 3 and 6 ppm. The aromatic agonist signals appear between 6.5 and 7.5 ppm, and a further agonist signal appears at ∼2.8 ppm between the cholesterol and phospholipids. The cross-peaks between the lipids and the LY-165,163 are used to give the location of the agonist relative to the other two components of the membrane.
FIGURE 8.
FIGURE 8.
Cross-relaxation rates between DPPC or cholesterol and agonists derived from MAS-NOESY measurements at the temperatures indicated. A, DPPC and LY-165,163 (9:1 mole ratio); B, DPPC and quipazine (9:1 mole ratio); C and E, DPPC-d62 plus cholesterol and LY-165,163 (7:2:1 mole ratio); D and F, DPPC-d62 plus cholesterol and quipazine (7:2:1 mole ratio). Black and gray bars represent positions 1 and 2 of each agonist as defined in the legend to Fig. 1, respectively. Black bars use the left axes, and gray bars use the right axes. Cross-relaxation rates are the mean of the results from three mixing times, and the error bars represent the S.D.

Similar articles

Cited by

References

    1. Vauquelin G., Packeu A. (2009) Mol. Cell. Endocrinol. 311, 1–10 - PMC - PubMed
    1. Castanho M. A., Fernandes M. X. (2006) Eur. Biophys. J. 35, 92–103 - PubMed
    1. Eisensamer B., Uhr M., Meyr S., Gimpl G., Deiml T., Rammes G., Lambert J. J., Zieglgänsberger W., Holsboer F., Rupprecht R. (2005) J. Neurosci. 25, 10198–10206 - PMC - PubMed
    1. Allen J. A., Halverson-Tamboli R. A., Rasenick M. M. (2007) Nat. Rev. Neurosci. 8, 128–140 - PubMed
    1. Lombardi D., Cuenoud B., Krämer S. D. (2009) Eur. J. Pharm. Sci. 38, 533–547 - PubMed

Publication types

MeSH terms