Social complexity and linguistic diversity in the Austronesian and Bantu population expansions
- PMID: 20961903
- PMCID: PMC3061144
- DOI: 10.1098/rspb.2010.1942
Social complexity and linguistic diversity in the Austronesian and Bantu population expansions
Abstract
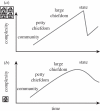
Reconstructing the rise and fall of social complexity in human societies through time is fundamental for understanding some of the most important transformations in human history. Phylogenetic methods based on language diversity provide a means to reconstruct pre-historic events and model the transition rates of cultural change through time. We model and compare the evolution of social complexity in Austronesian (n = 88) and Bantu (n = 89) societies, two of the world's largest language families with societies representing a wide spectrum of social complexity. Our results show that in both language families, social complexity tends to build and decline in an incremental fashion, while the Austronesian phylogeny provides evidence for additional severe demographic bottlenecks. We suggest that the greater linguistic diversity of the Austronesian language family than Bantu likely follows the different biogeographic structure of the two regions. Cultural evolution in both the Bantu and Austronesian cases was not a simple linear process, but more of a wave-like process closely tied to the demography of expanding populations and the spatial structure of the colonized regions.
Figures


Similar articles
-
Geographical and social isolation drive the evolution of Austronesian languages.PLoS One. 2020 Dec 1;15(12):e0243171. doi: 10.1371/journal.pone.0243171. eCollection 2020. PLoS One. 2020. PMID: 33259529 Free PMC article.
-
Genome-wide evidence of Austronesian-Bantu admixture and cultural reversion in a hunter-gatherer group of Madagascar.Proc Natl Acad Sci U S A. 2014 Jan 21;111(3):936-41. doi: 10.1073/pnas.1321860111. Epub 2014 Jan 6. Proc Natl Acad Sci U S A. 2014. PMID: 24395773 Free PMC article.
-
Rise and fall of political complexity in island South-East Asia and the Pacific.Nature. 2010 Oct 14;467(7317):801-4. doi: 10.1038/nature09461. Nature. 2010. PMID: 20944739
-
Macro-evolutionary studies of cultural diversity: a review of empirical studies of cultural transmission and cultural adaptation.Philos Trans R Soc Lond B Biol Sci. 2011 Feb 12;366(1563):402-11. doi: 10.1098/rstb.2010.0238. Philos Trans R Soc Lond B Biol Sci. 2011. PMID: 21199844 Free PMC article. Review.
-
Ancient migration routes of Austronesian-speaking populations in oceanic Southeast Asia and Melanesia might mimic the spread of nasopharyngeal carcinoma.Chin J Cancer. 2011 Feb;30(2):96-105. doi: 10.5732/cjc.010.10589. Chin J Cancer. 2011. PMID: 21272441 Free PMC article. Review.
Cited by
-
Cultural phylogenetics of the Tupi language family in lowland South America.PLoS One. 2012;7(4):e35025. doi: 10.1371/journal.pone.0035025. Epub 2012 Apr 10. PLoS One. 2012. PMID: 22506065 Free PMC article.
-
Scaling human sociopolitical complexity.PLoS One. 2020 Jul 2;15(7):e0234615. doi: 10.1371/journal.pone.0234615. eCollection 2020. PLoS One. 2020. PMID: 32614836 Free PMC article.
References
-
- Carneiro R. 1970. A theory of the origin of the state. Science 169, 733–79810.1126/science.169.3947.733 (doi:10.1126/science.169.3947.733) - DOI - DOI - PubMed
-
- Sanderson S. 1999. Social transformations: a general theory for historical development. Lanham, MD: Rowman and Littlefield
-
- Johnson A., Earle T. 2000. The evolution of human societies: from foraging group to Agrarian state. Stanford, CA: Stanford University Press
-
- Service E. 1975. Origins of the state and civilization: the process of cultural evolution. New York, NY: Norton
-
- Mann M. 1986. The sources of social power I. A history of power from the beginning to AD 1760. Cambridge, UK: Cambridge University Press
Publication types
MeSH terms
LinkOut - more resources
Full Text Sources

