. 2010 Dec 15;588(Pt 24):5089-104.
doi: 10.1113/jphysiol.2010.198283. Epub 2010 Oct 20.

Effects of inactivity on human muscle glutathione synthesis by a double-tracer and single-biopsy approach

Affiliations

Effects of inactivity on human muscle glutathione synthesis by a double-tracer and single-biopsy approach

Francesco Agostini et al. J Physiol. .

Abstract

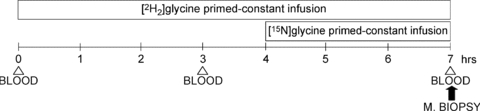
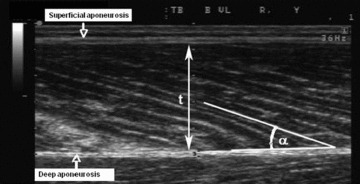
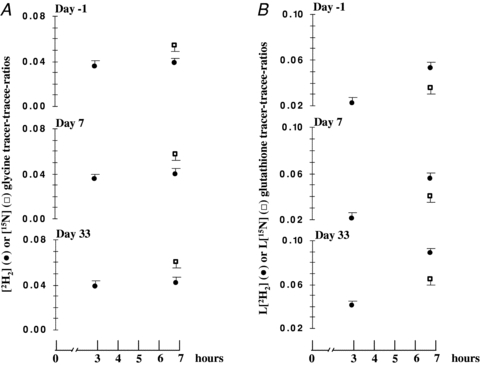
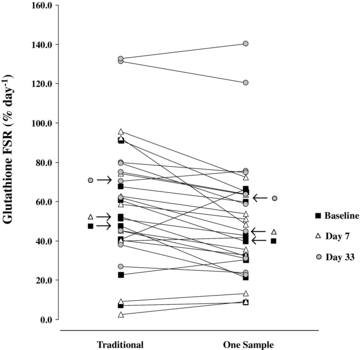
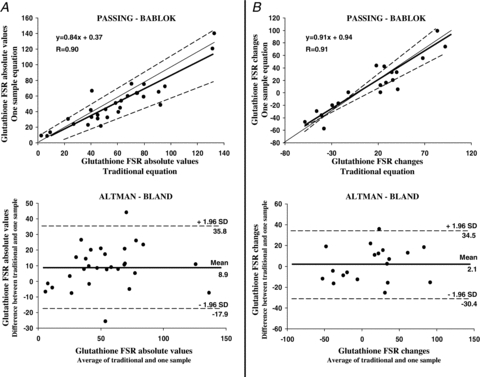
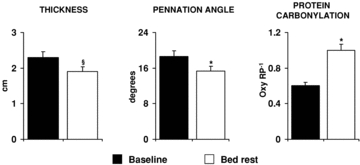
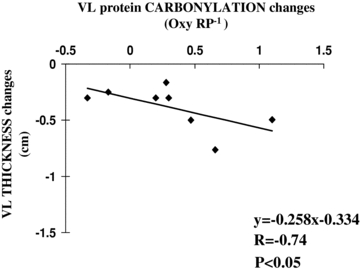
Oxidative stress is often associated to inactivity-mediated skeletal muscle atrophy. Glutathione is one of the major antioxidant systems stimulated, both at muscular and systemic level, by activation of oxidative processes. We measured changes in glutathione availability, oxidative stress induction and the extent of atrophy mediated by 35 days of experimental bed rest in vastus lateralis muscle of healthy human volunteers. To assess muscle glutathione synthesis, we applied a novel single-biopsy and double-tracer ([(2)H(2)]glycine and [(15)N]glycine) approach based on evaluation of steady-state precursor incorporation in product. The correlations between the traditional (multiple-samples, one-tracer) and new (one-sample, double-tracer infusion) methods were analysed in erythrocytes by Passing-Bablok and Altman-Bland tests. Muscle glutathione absolute synthesis rate increased following bed rest from 5.5 ± 1.1 to 11.0 ± 1.5 mmol (kg wet tissue)(-1) day(-1) (mean ± S.E.M.; n = 9; P = 0.02) while glutathione concentration failed to change significantly. Bed rest induced vastus lateralis muscle atrophy, as assessed by pennation angle changes measured by ultrasonography (from 18.6 ± 1.0 to 15.3 ± 0.9 deg; P = 0.01) and thickness changes (from 2.3 ± 0.2 to 1.9 ± 0.1 cm; P < 0.001). Moreover, bed rest increased protein oxidative stress, as measured by muscle protein carbonylation changes (from 0.6 ± 0.1 to 1.00 ± 0.1 Oxydized-to-total protein ratio; P < 0.04). In conclusion, we developed in erythrocytes a new minimally invasive method to determine peptide synthesis rate in human tissues. Application of the new method to skeletal muscle suggests that disuse atrophy is associated to oxidative stress induction as well as to compensatory activation of the glutathione system.


Figures

Figure 1
Figure 1. Metabolic test
BLOOD, blood sample; M. BIOPSY, vastus lateralis muscle biopsy. The metabolic study was scheduled to apply and validate the novel one-sample and double-tracer approach (see Methods) for glutathione kinetics assessment in a single muscle biopsy. A [2H2]glycine primed (26.5 μmol kg−1) infusion (26.5 μmol (kg h)−1) was started at the beginning of the study and a second primed (26.5 μmol kg−1) infusion (26.5 μmol kg−1 h−1) of [15N]glycine was started 4 h later. Enrichments of precursors ([2H2]glycine and [15N]glycine) and of products (l-[15N]glutathione and l-[2H2] glutathione) were measured in the single final biopsy (7th hour). l-[15N]Glutathione enrichment reflects short term tracer incorporation (3 h) while l-[2H2]glutathione enrichment reflects long term incorporation (7 h). We then calculated muscle glutathione kinetics applying the one-sample, double-tracer equation based on the difference between measured product enrichments (changes over time). For validation of the approach, isotopic enrichments of [2H2]glycine and l-[2H2]glutathione were measured in two different blood samples taken 3 and 7 h after the metabolic study began. The traditional equation was applied to calculate glutathione synthesis rate in red blood cells. Blood samples were drawn at baseline, day 7 and day 33 while muscle biopsies were taken at baseline and day 33.
Figure 2
Figure 2. Ultrasound imaging of pennation angle
Typical ultrasound image of the human vastus lateralis muscle obtained in the sagittal plane using a linear 7.5 MHz probe. Muscle fibres fascicles are clearly visible as the structures stretching from the superficial and deep aponeuroses. t, muscle thickness; α, pennation angle.
Figure 3
Figure 3. Enrichments of isotopic tracers and products before, during and after bed rest in red blood cells
Red blood cells enrichments of isotopic tracers ([2H2] and [15N]glycine) and products ([2H2] and l-[15N]glutathione). A, steady state for [2H2]glycine (•) precursor pool is shown while steady state condition for [15N]glycine (□) pool is assumed. Diversity between tracer isotope steady state values is due to intrinsic metabolic differences between 2H2 and 15N isotopes. B, l-[2H2]glutathione (•) enrichment slope increase reflects linear tracer incorporation into glutathione products. Diversity between l-[2H2]glutathione and l-[15N]glutathione (□) product enrichments measured at the end of infusions (7th hour) is the result of different tracer incorporation times. [2H2]glycine was, in fact, infused for 7 h while [15N]glycine was infused for 3 h.
Figure 4
Figure 4. Bed rest impact on erythrocytes’ glutathione kinetics
Red blood cells’ glutathione fractional synthesis rate (FSR) individual values measured by both the traditional and one sample approaches at selected study phases (Baseline, Day 7 and Day 33). Significant differences between FSR measured by traditional and novel one-sample approaches failed to be displayed in each study phase. No significant influence of bed rest on FSR values was shown, regardless of the equation applied.
Figure 5
Figure 5. Method validation
Traditional and one-sample approaches validation by Altman–Bland method and by analysis of linear regression of correlations by Passing–Bablok approach, applied to measurements of glutathione kinetics in erythrocytes. A, glutathione fractional synthesis rate (FSR) absolute values (% day−1) measured in red blood cells by ‘traditional’ and by ‘one-sample’ approach are in positive and significant (P < 0.001) linear correlation (Passing–Bablok plot, upper part) (n= 29). As evidenced in Table 1 slope and intercept are contained in their relative confidence intervals as analysed by Passing–Bablok test. Altman–Bland plot (lower part) of glutathione FSR absolute values shows only two measurements are outside the confidence interval and that data distribution across the mean can be considered as satisfactory. B, pooled changes of glutathione FSR (% day−1) from baseline to day 7 and to day 33 measured by ‘standard’ approach are in significant and positive (P < 0.001) linear correlation with analogous changes in glutathione FSR measured by the ‘one-sample’ approach (Passing–Bablok plot, upper part) (n= 19). As evidenced in Table 1, slope and intercept are contained in their relative confidence intervals as analysed by Passing–Bablok. An Altman–Bland plot of glutathione FSR changes shows only one measurement is outside the confidence interval and that data distribution across the mean can be considered as satisfactory. In Passing–Bablok plots regression lines are represented as continuous thick lines, identity lines (x=y) as continuous thin lines while limits of confidence intervals are dashed lines. In Altman–Bland plots the mean value line is represented by a continuous thick line while limits of confidence intervals are dashed lines.
Figure 6
Figure 6. Bed rest effects on vastus lateralis muscle atrophy and oxidative stress
Values of vastus lateralis thickness, fibre pennation angle and protein carbonylation measured before (Baseline) and after 33 days of bed rest (Bed rest) are shown. Muscle thickness and fibre pennation angle were determined in supine position by ultrasonography approaches. Protein carbonylation was determined by Oxyblot analysis. Oxy RP−1, ratio between quantified oxidized proteins and Red Ponceau stained total protein. §P < 0.001 vs. Baseline; *P < 0.05 vs. Baseline. Statistical analysis was performed by Student's t test.
Figure 7
Figure 7. Correlations between bed rest mediated changes in muscle atrophy and redox markers in vastus lateralis
The figure shows a significant linear indirect correlation between protein carbonylation and vastus lateralis (VL) muscle thickness changes mediated by bed rest. Relationship between variables was analysed by bivariate correlation using Spearman's test. Continuous line represents the regression line.

References

    1. Ahmad R, Tripathi AK, Tripathi P, Singh S, Singh R, Singh RK. Malondialdehyde and protein carbonyl as biomarkers for oxidative stress and disease progression in patients with chronic myeloid leukemia. In Vivo. 2008;22:525–528. - PubMed
    1. Altomare E, Vendemiale G, Albano O. Hepatic glutathione content in patients with alcoholic and non alcoholic liver diseases. Life Sci. 1988;43:991–998. - PubMed
    1. Anderson ME. Glutathione and glutathione delivery compounds. Adv Pharmacol. 1997;38:65–78. - PubMed
    1. Badaloo A, Reid M, Forrester T, Heird WC, Jahoor F. Cysteine supplementation improves the erythrocyte glutathione synthesis rate in children with severe edematous malnutrition. Am J Clin Nutr. 2002;76:646–652. - PubMed
    1. Banerjee AK, Mandal A, Chanda D, Chakraborti S. Oxidant, antioxidant and physical exercise. Mol Cell Biochem. 2003;253:307–312. - PubMed

Publication types

LinkOut - more resources