

Critical speed in the rat: implications for hindlimb muscle blood flow distribution and fibre recruitment
- PMID: 20962004
- PMCID: PMC3036198
- DOI: 10.1113/jphysiol.2010.198382
Critical speed in the rat: implications for hindlimb muscle blood flow distribution and fibre recruitment
Abstract
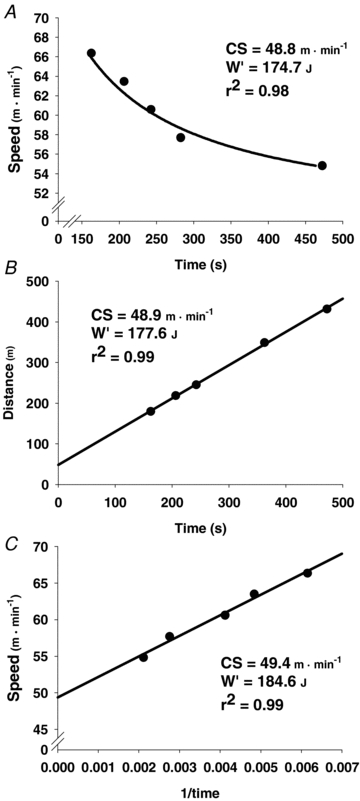
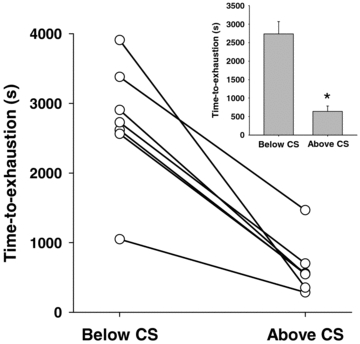
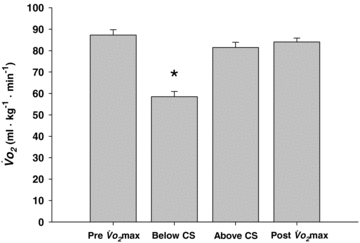
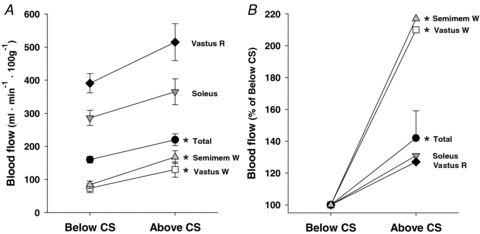
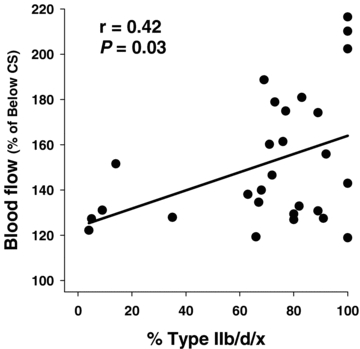
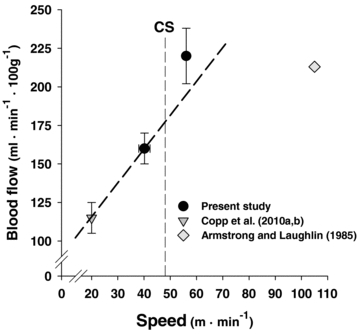
Critical speed (CS) constitutes an important metabolic and performance demarcator. However, active skeletal muscle blood flow distribution specifically surrounding CS remains unknown. We tested the hypotheses that CS could be accurately determined in the running rat and that measurement of hindlimb inter- and intramuscular blood flow below and above CS would support that the greatest muscle fibre recruitment above, relative to below, CS occurs in the predominantly glycolytic muscles. Seven male Sprague-Dawley rats performed five constant-speed tests to exhaustion at speeds between 95 and 115% of the speed that elicited to determine CS. Subsequent constant-speed tests were performed at speeds incrementally surrounding CS to determine time to exhaustion, V(O2), and hindlimb muscle blood flow distribution. Speed and time to exhaustion conformed to a hyperbolic relationship (r(2) = 0.92 ± 0.03) which corresponded to a linear 1/time function (r(2) = 0.93 ± 0.02) with a CS of 48.6 ± 1.0 m min(-1). Time to exhaustion below CS was ∼ 5× greater (P < 0.01) than that above. Below CS V(O2) stabilized at a submaximal value (58.5 ± 2.5 ml kg(-1) min(-1)) whereas above CS (81.7 ± 2.5 ml kg(-1) min(-1)) increased to (84.0 ± 1.8 ml kg(-1) min(-1), P > 0.05 vs. above CS). The 11 individual muscles or muscle parts that evidenced the greatest blood flow increases above, relative to below, CS were composed of ≥ 69% Type IIb/d/x muscle fibres. Moreover, there was a significant correlation (P < 0.05, r = 0.42) between the increased blood flow above expressed relative to below CS and the percentage Type IIb/d/x fibres found in the individual muscles or muscle parts. These data validate the powerful CS construct in the rat and identify that running above CS, relative to below CS, incurs disproportionate blood flow increases (indicative of recruitment) in predominantly highly glycolytic muscle fibres.
Figures
Comment in
-
Comfortable at just below your critical speed: how is blood flow distribution coupled to muscle fibre recruitment during exercise?J Physiol. 2011 May 1;589(Pt 9):2113-4. doi: 10.1113/jphysiol.2011.206342. J Physiol. 2011. PMID: 21532031 Free PMC article. No abstract available.
References
-
- Armstrong RB, Laughlin MH. Rat muscle blood flows during high-speed locomotion. J Appl Physiol. 1985;59:1322–1328. - PubMed
-
- Billat VL, Mouisel E, Roblot N, Melki J. Inter- and intrastrain variation in mouse critical running speed. J Appl Physiol. 2005;98:1258–1263. - PubMed
-
-
Copp SW, Davis RT, Poole DC, Musch TI. Reproducibility of endurance capacity and
 peak in male Sprague-Dawley rats. J Appl Physiol. 2009;106:1072–1078.
-
PubMed
peak in male Sprague-Dawley rats. J Appl Physiol. 2009;106:1072–1078.
-
PubMed
-
Copp SW, Davis RT, Poole DC, Musch TI. Reproducibility of endurance capacity and
Publication types
MeSH terms
LinkOut - more resources
Full Text Sources
Miscellaneous