. 2010 Dec 15;588(Pt 24):4905-25.
doi: 10.1113/jphysiol.2010.195644. Epub 2010 Oct 20.

Segmental patterns of vestibular-mediated synaptic inputs to axial and limb motoneurons in the neonatal mouse assessed by optical recording

Affiliations

Segmental patterns of vestibular-mediated synaptic inputs to axial and limb motoneurons in the neonatal mouse assessed by optical recording

Nedim Kasumacic et al. J Physiol. .

Abstract

Proper control of movement and posture occurs partly via descending projections from the vestibular nuclei to spinal motor circuits. Days before birth in rodents, vestibulospinal neurons develop axonal projections that extend to the spinal cord. How functional these projections are just after birth is unknown. Our goal was to assess the overall functional organization of vestibulospinal inputs to spinal motoneurons in a brainstem-spinal cord preparation of the neonatal mouse (postnatal day (P) 0-5). Using calcium imaging, we recorded responses evoked by electrical stimulation of the VIIIth nerve, in many motoneurons simultaneously throughout the spinal cord (C2, C6, T7, L2 and L5 segments), in the medial and lateral motor columns. Selective lesions in the brainstem and/or spinal cord distinguished which tracts contributed to the responses: those in the cervical cord originated primarily from the medial vestibulospinal tracts but with a substantial contribution from the lateral vestibulospinal tract; those in the thoracolumbar cord originated exclusively from the lateral vestibulospinal tract. In the thoracolumbar but not the cervical cord, excitatory commissural connections mediated vestibular responses in contralateral motoneurons. Pharmacological blockade of GABA(A) receptors showed that responses involved a convergence of excitatory and inhibitory inputs which in combination produced temporal response patterns specific for different segmental levels. Our results show that by birth vestibulospinal projections in rodents have already established functional synapses and are organized to differentially regulate activity in neck and limb motoneurons in a tract- and segment-specific pattern similar to that in adult mammals. Thus, this particular set of descending projections develops several key features of connectivity appropriately at prenatal stages. We also present novel information about vestibulospinal inputs to axial motoneurons in mammals, providing a more comprehensive platform for future studies into the overall organization of vestibulospinal inputs and their role in regulating postural stability.


Figures
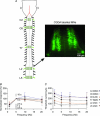
Figure 2
Figure 2. Motoneuron labelling for optical recording and effective stimulation parameters
A, schematic overview of labelled MNs in different segments (left) and photograph of CGDA-labelled MNs in L2 (right). B and C, effective stimulation parameters for evoking Ca2+ responses in iMMC or iLMC in the different spinal segments investigated. The graph in B displays the amplitude–frequency curves when stimulating at 2T with a 5 s train and the response magnitudes as a function of train duration when stimulating at 2T and 5 Hz (individual open circles). Each response is an average (total of 4 experiments or 20–76 MNs) and is expressed as a percentage of the response at 5 Hz. The graph in C displays the magnitudes of the responses elicited by stimulating the VIIIth nerve at threshold current (T) with a 5 s train, as a function of frequency. Each response is an average of 4 experiments (5–19 MNs per experiment). All values are means ± standard deviations.
Figure 3
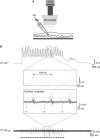
Figure 3. Correspondence between somatic Ca2+ responses and ventral root discharge
A, after retrogradely labelling the T7 ventral root (VR) with CGDA-1, the root was inserted in a suction electrode to record the axonal discharge. B, simultaneous recordings of the calcium response from T7 MNs (top) and the MN population discharge in the T7 ventral root (bottom) during electrical stimulation of the VIIIth nerve. The Ca2+ signal here was recorded at 100 (rather than the usual 4) frames per second and the ventral root signal was recorded at 5 kHz. As best shown in the insets between the traces, each Ca2+ transient corresponded to a burst of activity in the ventral root. In the lower inset, the rectified and integrated ventral root signal was added to facilitate comparison. Vertical arrows at the bottom indicate stimulation artefacts on the ventral root recording.
Figure 1
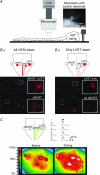
Figure 1. Brainstem–spinal cord preparation and vestibulospinal neuron activation
A, diagram of the experimental arrangement used for imaging Ca2+ responses in individual spinal MNs in the living brainstem–spinal cord preparation. Inset, image of a glass suction electrode placed around the proximal end of the cut VIIIth nerve for vestibular afferent stimulation. B, the three vestibulospinal groups investigated in this study were defined by retrograde labelling and by isolation of the LVST group by bilateral lesion of the MLF. Ba, rhodamine dextran amine (RDA) applied to the ipsilateral ventral and ventrolateral funiculi at C1 labels three groups of vestibulospinal neurons: two groups projecting respectively ipsilaterally and contralaterally in the MLF (iMVST and cMVST) and one group with axons projecting laterally in the medulla and spinal cord (LVST). Bb, RDA-labelled vestibulospinal neurons after a bilateral lesion of the MLF which interrupts the projections from both the iMVST and cMVST groups. As shown, the lesion effectively prevents retrograde labelling of the iMVST and cMVST groups, permitting the study of vestibular responses mediated by the LVST group in isolation. The scale bars on the higher magnification photomicrograph insets are 50 μm. C, upper left, schematic illustration of the relative locations of the 3 vestibulospinal neuron populations that give rise, respectively, to the cMVST, the iMVST and the LVST as seen after retrograde labelling and examples of responses evoked in CGDA-labelled vestibulospinal neurons during VIIIth nerve stimulation. Bottom, pseudocolour representations of the fluorescence intensities in CGDA-labelled vestibulospinal neurons (those most dorsally located and therefore principally LVST neurons) before and during VIIIth nerve stimulation (train of 5 s at 2T and 5 Hz) in a P0 mouse. An increase in Ca2+ fluorescence intensity during the stimulation indicates that electrical activation of the VIIIth nerve effectively activates the synaptic connections to the vestibulospinal neurons. Upper right, waveforms of fluorescence intensity in the four vestibulospinal neurons labelled 1–4. During the first session the VIIIth nerve was stimulated with a single pulse whereas during the second session the nerve was stimulated with a 5 s train. Scale bar: 50 μm.
Figure 6
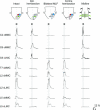
Figure 6. Effects of various lesions on vestibular-mediated response patterns in ipsilateral MNs
From top to bottom, traces showing the averaged response (n= 6 MNs) evoked in ipsilateral MNs in each of the segments studied. Each trace represents data from an individual experiment. The first and third columns show the typical responses in intact preparations and preparations with a bilateral MLF lesion, respectively (C2 and C6 from P2 mice, T7 from a P1 and a P4 mouse, L2 from a P3 and a P2 mouse and L5 from P3 mice). The second column (ipsilateral hemisection) and the last two columns (contralateral hemisection and midline spinal cord lesion) are from different experiments (ipsilateral hemisection: C2, C6, T7, L2 and L5 from P2 mice, contralateral hemisection: C2 from a P2 mouse, C6 from a P3 mouse, T7 and L2 from P1 mice and L2 from a P2 mouse, midline lesion: C2, C6, T7, L2 and L5 from P3 mice). The contralateral hemisections were performed either at the level of the obex (C2 and C6) or at C1 (T7, L2 and L5).
Figure 8
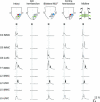
Figure 8. Vestibular-mediated response patterns in contralateral MNs and effects of various lesions
From top to bottom, traces showing the averaged response (n= 6 MNs) evoked in contralateral MNs in each of the segments studied. Each trace represents data from an individual experiment. The data shown in the first and the third columns (intact and bilateral MLF lesion) are from the same experiments (C2 and C6 from a P1 mouse, T7 from a P2 mouse, L2 from a P3 mouse and L5 from a P2 mouse). The second column (ipsilateral hemisection) and the last two (contralateral hemisection and midline spinal cord lesion) are from different experiments (ipsilateral hemisection: C2 and C6 from P2 mice, T7 from a P3 mouse, L2 and L5 from P1 mice; contralateral hemisection: C2 and C6 from P1 mice, T7 and L2 from P3 mice and L5 from a P2 mouse; midline lesion: C2 and C6 from P2 mice, T7 and L2 from P3 mice and L5 from a P2 mouse). The contralateral hemisections were performed either at the level of the obex (C2 and C6) or at C1 (T7, L2 and L5).
Figure 9
Figure 9. Effects of lesions that sever most reticulospinal projections on vestibular nerve-evoked responses in spinal MNs
Aa and b, diagrams showing the distribution of retrogradely labelled neurons following application of RDA to ipsilateral VF + VLF at the level of C1. The distribution in Aa was plotted from an intact preparation (P2 mouse) and that in Ab from a preparation in which a broad transverse lesion of the brainstem was made (thick dashed black line, P2 mouse). iMVST, cMVST and LVST neurons are shown together with their axonal trajectories in red, green and blue, respectively, and reticulospinal and trigeminospinal neurons are shown as black dots. For the sake of clarity, each dot represents 1–3 retrogradely labelled neurons in the case of vestibulospinal neurons and 4–6 retrogradely labelled neurons in the case of the reticulospinal and trigeminospinal neurons. As shown, such a large brainstem lesion interrupted many descending connections including all contralateral projections, all iMVST projections, all medial reticulospinal projections and more than 50% of the LVST projections. Some of the ipsilateral projections including part of the LVST projection and all lateral reticulospinal and trigeminospinal projections were left intact. B, graph showing the normalized response ratios obtained by directly comparing the responses before and after the brainstem lesion in the same preparation. Each data point is from a single preparation and the horizontal lines indicate the grand mean.
Figure 4
Figure 4. Vestibular-mediated response patterns in ipsilateral MNs of the cervical, thoracic and lumbar segments
Sequential recordings of the fluorescence activity in CGDA-labelled MNs in iMMC alone (C2 and T7 segments) and both iMMC and iLMC (C6, L2 and L5 segments) before, during and after VIIIth nerve stimulation at 5 s, 5 Hz, 2T. The postnatal ages at which the recordings shown were made are: P1 (C2), P1 (C6), P3 (T7), P4 (L2) and P2 (L5). Each set of data comprises a series of three high magnification micrographs shown as pseudocolour representations (250 ms frame duration) of the fluorescence intensity at 5, 15 and 30 s from the onset of the recording session (i.e. before, during and after the stimulation) and corresponding average waveforms (n= 6 MNs or ROIs) showing the changes in fluorescence throughout the entire 120 s recording session. The pseudocolour representations were made by filtering the complete image series of the recording session in Metamorph with a low pass 3 × 3 filter and then converting greyscale values to colours using a rainbow index, with transition from blue to red to white representing increasing response size. On the first of each series of three frames, the circles indicate the location of the manually defined ROIs placed over 6 MNs in each motor column, and on the last frame, the scale bar is 50 μm. The duration of the stimulation is shown on the waveform displays with vertical grey shading. Grey arrows indicate occasional spontaneous increases in Ca2+ fluorescent.
Figure 5
Figure 5. Mephenesin strongly reduces the magnitude of the vestibular-mediated responses and blockade of GABAA receptors reveals an inhibitory component in the iMMC response of C2 and the iLMC response of L2
A, responses evoked during electrical stimulation of the VIII nerve with a 5 s train at 5 Hz (2T) in the iMMC of C2 and T7 and the iLMC of L2 before (traces on the left) and after (traces on the right) application of mephenesin to a split-bath compartment containing the cervico-thoraco-lumbar or thoraco-lumbar regions of the spinal cord. B, graph showing the magnitudes of the responses during mephenesin application, normalized to the control response. Each point shows the average response in a single preparation and the horizontal lines indicate the grand mean. C, left traces, responses evoked during electrical stimulation of the VIII nerve with a 5 s train at 5 Hz (2T) in the iMMC of C2 and the iLMC of L2. Middle and right traces, effects of 20 μm biccuculine and 40 μm PTX on these responses. D, graph showing the magnitudes of the responses during application of each drug, normalized to the control response. Each point shows the average response in a single preparation and the horizontal lines indicate the grand mean.
Figure 7
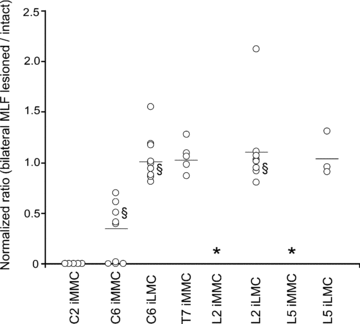
Figure 7. Graphical summary of the effects of bilateral MLF lesion on the response patterns in ipsilateral MNs
The graph displays the normalized response ratios in ipsilateral MNs, obtained by directly comparing the responses before and after bilateral MLF lesion in the same preparation. Each data point represents a single preparation and the horizontal lines indicate the grand mean ratio. The bilateral MLF lesion eliminated the response in the iMMC of C2 and greatly decrease the iMMC responses in C6 but had no significant effect on the iMMC responses in T7. In L2 and L5, VIIIth nerve stimulation remained ineffective in evoking responses in the iMMC (indicate with an asterisk) and had no significant effect on the LMC responses. § indicates that the data point is from an experiment performed in a mouse strain other than ICR (Balb C, N-ZEG or Nkx 6.2lacZ).
Figure 10
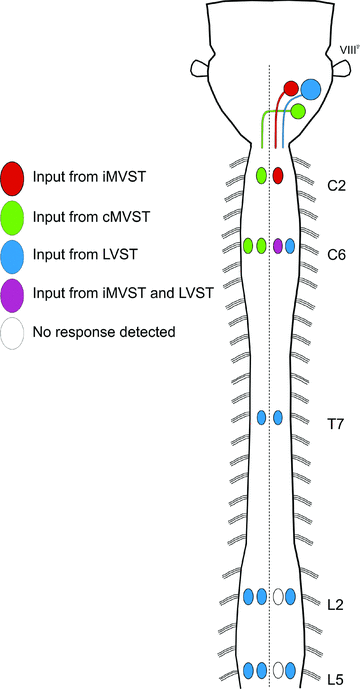
Figure 10. Proposed functional organization of vestibulospinal inputs to axial and limb MNs in the neonatal mouse
Schematic representation of a neonatal mouse brainstem and spinal cord summarizing the vestibulospinal synaptic connections to ipsi- and contralateral axial and limb MNs observed in this study. A colour code (shown on the left) is used to show the pattern of connections from each vestibulospinal group to the various groups of MNs in the different spinal segments. The connections represent both mono- and polysynaptic connections and include both excitatory and inhibitory components.

Similar articles

Cited by

References

    1. Akaike T, Fanardjian VV, Ito M, Ono T. Electrophysiological analysis of the vestibulospinal reflex pathway of rabbit. II. Synaptic actions upon spinal neurones. Exp Brain Res. 1973;17:497–515. - PubMed
    1. Altman J, Bayer SA. Development of the brain stem in the rat. II. Thymidine-radiographic study of the time of origin of neurons of the upper medulla, excluding the vestibular and auditory nuclei. J Comp Neurol. 1980a;194:37–56. - PubMed
    1. Altman J, Bayer SA. Development of the brain stem in the rat. IV. Thymidine-radiographic study of the time of origin of neurons in the pontine region. J Comp Neurol. 1980b;194:905–929. - PubMed
    1. Aoyama M, Hongo T, Kudo N, Tanaka R. Convergent effects from bilateral vestibulospinal tracts on spinal interneurons. Brain Res. 1971;35:250–253. - PubMed
    1. Auclair F, Bélanger MC, Marchand R. Ontogenetic study of early brain stem projections to the spinal cord in the rat. Brain Res Bull. 1993;30:281–289. - PubMed

Publication types

LinkOut - more resources