. 2010 Dec;24(12):2356-65.
doi: 10.1210/me.2010-0219. Epub 2010 Oct 20.

Prolactin inhibits activity of pyruvate kinase M2 to stimulate cell proliferation

Affiliations

Prolactin inhibits activity of pyruvate kinase M2 to stimulate cell proliferation

Bentley Varghese et al. Mol Endocrinol. 2010 Dec.

Abstract

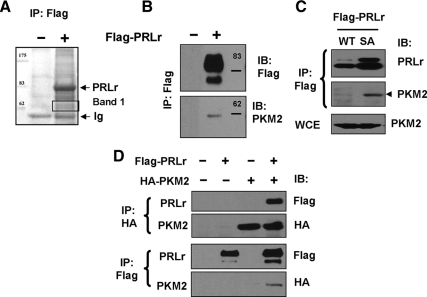
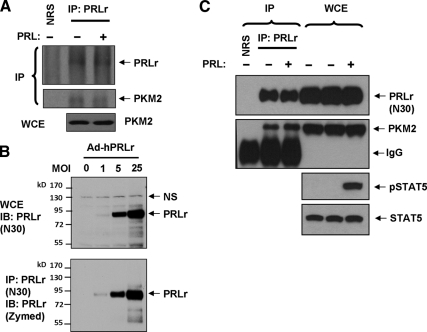
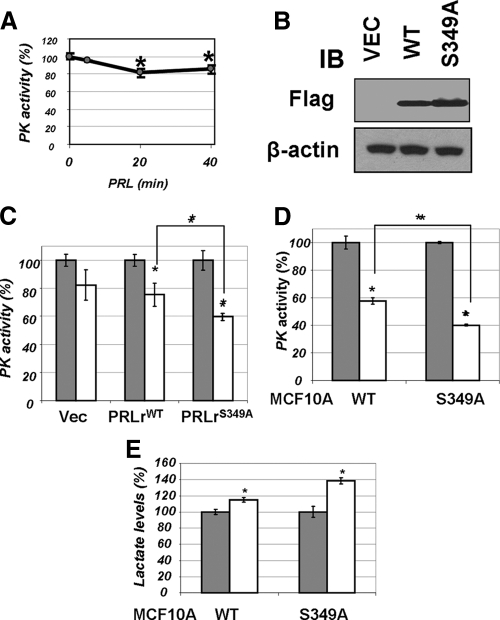
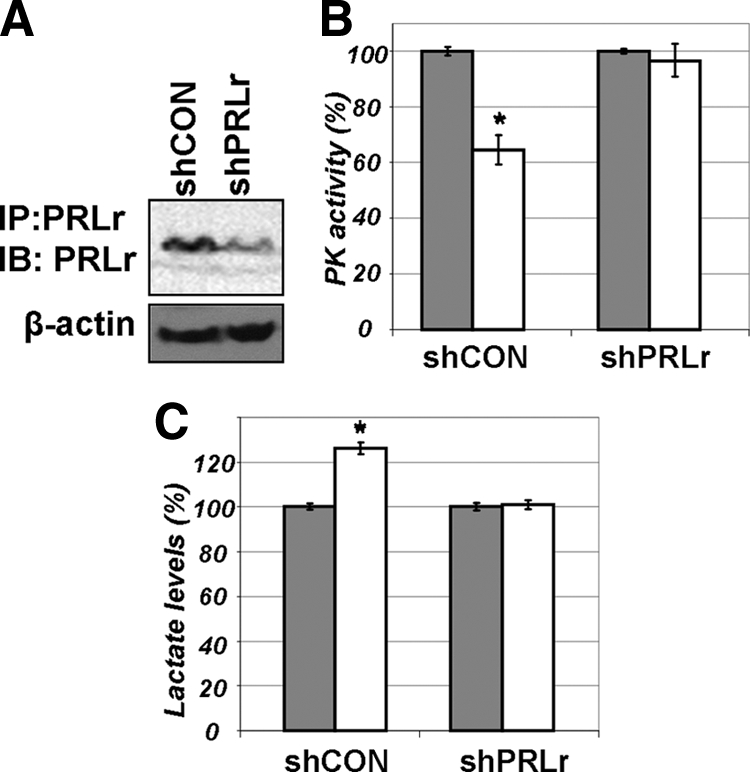
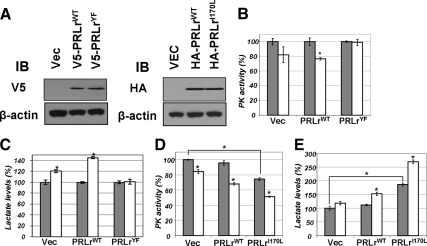
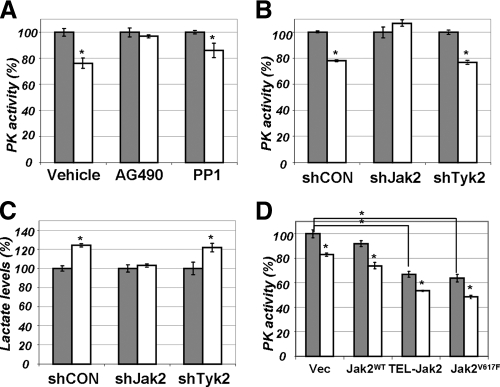
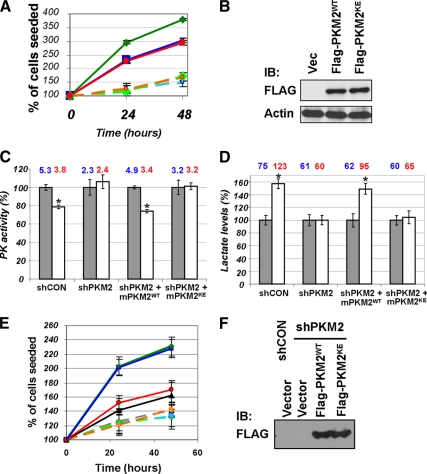
Mitogenic and prosurvival effects underlie the tumorigenic roles of prolactin (PRL) in the pathogenesis of breast cancer. PRL signaling is mediated through its receptor (PRLr). A proteomics screen identified the pyruvate kinase M2 (PKM2), a glycolytic enzyme known to play an important role in tumorigenesis, as a protein that constitutively interacts with PRLr. Treatment of cells with PRL inhibited pyruvate kinase activity and increased the lactate content in human cells in a manner that was dependent on the abundance of PRLr, activation of Janus kinase 2, and tyrosine phosphorylation of the intracellular domain of PRLr. Knockdown of PKM2 attenuated PRL-stimulated cell proliferation. The extent of this proliferation was rescued by the knock-in of the wild-type PKM2 but not of its mutant insensitive to PRL-mediated inhibition. We discuss a hypothesis that the inhibition of PKM2 by PRL contributes to the PRL-stimulated cell proliferation.


Figures

Figure 1
Figure 1
A, Whole-cell lysates from human embryonic kidney 293T cells transfected to express Flag-tagged PRLr or the corresponding control vector (pCDNA3) and treated with PRL were immunoprecipitated (IP) with anti-Flag M2 agarose followed by stringent washes to minimize nonspecific interactions. The proteins that copurified with PRLr were resolved by SDS-PAGE and visualized by Colloidal Coomassie staining. Indicated proteins (Band 1) were excised, digested with trypsin, and analyzed by LC-MS/MS. The results were searched against the NIH database using SEQUEST software. B, Material from the experiment shown in panel A was analyzed by immunoblotting (IB) using anti-Flag and anti-PKM2 antibodies. C, Lysates from the MCF10a-Δp53 cells stably expressing Flag-PRLr [wild type (WT) or SA mutant], previously characterized in Ref. were immunoprecipitated using Flag antibody and analyzed by IB using anti-PRLr antibody or anti-PKM2 antibody. Levels of PKM2 in the whole-cell extracts (WCE) are also shown. D, 293T cells transfected with Flag-tagged PRLr and HA-tagged PKM2 as indicated were lysed and IP-IB assays using anti-Flag and anti-HA antibody were carried out as depicted.
Figure 2
Figure 2
A, Immunoprecipitation (IP) of endogenous PRLr from lysates from 293T cells treated with or without human PRL (purchased from the National Hormone and Peptide program and used at 100 ng/ml for 30 min) was carried out using anti-PRLr antibody (H-300, Santa Cruz) or naïve rabbit serum (NRS). Levels of PKM2 in whole-cell extracts (WCE) are also shown. B, MDA-MB-231 cells were infected with adenoviruses for delivery of human PRLr at increasing multiplicity of infection (MOI). WCEs were prepared and aliquots were resolved by SDS-PAGE and subjected to direct immunoblotting (IB) using anti-PRLr (N30, upper panel). Additional aliquots of the extracts were immunoprecipitated with N30 antibody and analyzed by IB using monoclonal anti-PRLr antibody from Invitrogen. NS, Nonspecific band. C, Lysates from the T47D cells (treated with or without 100 ng/ml of PRL for 15 min as indicated) were immunoprecipitated using either NRS or anti-PRLr N30 polyclonal antibody. Levels of PRLr and PKM2 in these reactions were detected by IB as indicated. Levels of PKM2, PRLr, and total and phosphorylated in the WCEs are also shown. IgG, Immunoglobulin heavy chain.
Figure 3
Figure 3
A, Pyruvate kinase activity was determined in lysates (50 μg) from 293T cells treated with PRL (100 ng/ml for indicated time points) by a coupled enzymatic-based spectrophotometric assay as described in Materials and Methods. Average data from four independent experiments (each in triplicate) are presented as percent of activity measured in cells that did not receive PRL (±sd). Asterisks denote statistical significance of obtained differences (P < 0.05 by Student’s t test). B, Transient expression of indicated Flag-tagged PRLr species in 293T cells was verified by immunoblotting (IB) using indicated antibodies. C, Activity of pyruvate kinase was determined (as in panel A) in lysates from 293T cells transfected with vector control (pCDNA3) or vectors for expression of PRLr [wild type (WT) or S349A mutant] and treated (100 ng/ml PRL for 20 min, white bars) or not (gray bars) with PRL. Here and in similar subsequent figures, the average data from three independent experiments (each in triplicate) are presented as percent of activity of nontreated control cells (±sd). Absolute values of PKM activity in untreated cells transfected with different PRLr constructs were comparable (data not shown). Asterisks denote statistical significance of obtained differences (P < 0.05 by Student’s t test). D, Pyruvate kinase activity was measured in the lysates from MCF10a-derived cells expressing wild-type or S349A mutant of PRLr (described in details in Ref. 12) as in panel B. E, Lactate levels in the lysates from cells used in panel C were determined using a fluorescence-based lactate measurement assay. Asterisks signify that the difference in lactate levels between the treated and untreated samples is significant as determined by Student’s t test (P < 0.05).
Figure 4
Figure 4
A, Levels of endogenous PRLr in T47D-derived cells that harbor shCON or shRNA against PRLr (shPRLr) were determined by immunoprecipitation (IP)-immunoblotting (IB) as described in details in Ref. . B, Pyruvate kinase activity was measured in the lysates from T47D-derived cells that harbor shCON or shRNA against PRLr (shPRLr). Cells (that were described in details in Ref. 12) were left untreated (gray bars) or treated with PRL (100 ng/ml for 20 min, white bars). Absolute values of PKM activity in untreated cells transfected with different shRNA constructs were comparable (data not shown). Asterisks denote statistical significance of obtained differences (P < 0.05 by Student’s t test). C, Lactate levels in the lysates from cells used in panel B were determined as outlined in Fig. 3E.
Figure 5
Figure 5
A, Transient expression of indicated hemaggltinin (HA)-tagged and V5-tagged PRLr species in 293T cells was verified by immunoblotting (IB) using indicated antibodies. B, Activity of pyruvate kinase (PK) was determined (as in Fig. 3A) in lysates from 293T cells transfected with vector control (pCDNA3) or vectors for expression of PRLr [wild type or YF mutant (all intracellular tyrosines mutated to phenylalanine, described in Ref. 16)] and treated (100 ng/ml PRL for 20 min, white bars) or not (gray bars) with PRL. Absolute values of PKM activity in untreated cells transfected with either PRLrWT or PRLrYF were comparable (data not shown). Average data from four independent experiments (each in triplicate) are presented as percent of activity measured in cells that did not receive PRL (± sd). Asterisks denote statistical significance of obtained differences (P < 0.05 by Student’s t test). C, Lactate levels in the lysates from cells used in panel B were determined as outlined in Fig. 3E. D, PK activity was determined in lysates from 293T cells transfected with vector control (pCDNA3) or vectors for expression of PRLr (wild-type or I170L mutant). Asterisks denote statistical significance of obtained differences (P < 0.05 by Student’s t test). E, Lactate levels in the lysates from cells used in panel D were determined as outlined in Fig. 3E.
Figure 6
Figure 6
A, Pyruvate kinase (PK) activity was determined in lysates from 293T cells pretreated with ethanol (Vehicle), JAK inhibitor AG490 (AG490, Calbiochem, 50 μm), or Src inhibitor PP1 (PP1, Calbiochem, 10 μm). Cells were then were left untreated (gray bars) or treated with PRL (100 ng/ml for 20 min, white bars). Absolute values of PKM activity in the absence of PRL in vehicle, AG490, and PPI-treated cells were comparable (data not shown). Asterisks denote statistical significance of obtained differences (P < 0.05 by Student’s t test). B, PK activity was determined in lysates from 293T cells transfected with shCON, shRNA targeting JAK2 (shJAK2), or shRNA targeting Tyk2 (shTyk2) and either left untreated (gray bars) or treated with PRL (100 ng/ml for 20 min; white bars). Efficacy of these shRNAs (80–90% knockdown) have been previously reported (34). Absolute values of PKM activity in untreated cells transfected with different shRNA constructs were comparable (data not shown). Asterisks denote statistical significance of obtained differences (P < 0.05 by Student’s t test). C, Lactate levels in the lysates from cells used in panel B were determined. D, PK activity was determined in lysates from 293T cells transfected with vector control (pcDNA3) or vectors for expression of JAK2 (wild type or TEL-JAK2 fusion or V617F mutant). Cells were then were left untreated (gray bars) or treated with PRL (100 ng/ml for 20 min, white bars). Asterisks denote statistical significance of obtained differences (P < 0.05 by Student’s t test).
Figure 7
Figure 7
A, The rate of proliferation of rat lymphoma Nb2–11C cells electroporated with a vector control (blue squares), wild-type murine Flag-PKM2 (PKM2WT, green diamonds), or murine Flag-PKM2K433E (PKM2KE, red circles). Cells (1 ×10⁶) were plated in triplicate for each sample and time point and cultured in the absence (dashed lines, light colors) or presence of PRL (200 ng/ml, solid lines and intense colors). Trypan blue-negative live cells were counted at 24 and 48 h after plating. Average data from three independent experiments (each in triplicate) are presented as percent of number of initially seeded cells (± sd). Asterisks signify that the difference in growth rates between the treated and untreated samples is significant as determined by Student’s t test (P < 0.05). B, Material from experiment shown in panel A was analyzed by immunoblotting (IB) using anti-Flag and anti-β-actin antibodies. C, Pyruvate kinase (PK) activity was determined (as in Fig. 2A) in lysates from PRL-deficient MCF7 cells transfected with a control shRNA or shRNA targeting PKM2 [alone or in addition to an expression vector expressing a nontargetable murine PKM2 protein (wild type or K433E mutant)] and treated (200 ng/ml PRL for 30 min, white bars) or not (gray bars) with PRL. Bar data reflect percent changes whereas average absolute PKM activity numbers (in arbitrary units) are depicted above the bars in either blue (untreated cells) or red (PRL-treated cells). Asterisks denote statistical significance of obtained differences (P < 0.05 by Student’s t test). PRL-deficient MCF7 cells (37) and control and PKM2-specific shRNA lentiviral vectors [∼70–80% knockdown efficacy (21)] have been previously described. D, Lactate levels in the lysates from cells used in panel C were determined. Bar data reflect percent changes whereas average absolute lactate concentrations (in arbitrary units) are depicted above the bars in either blue (untreated cells) or red (PRL-treated cells). E, The rate of proliferation of MCF7-derived cells treated (solid lines, intense colors) or not (dashed lines, light colors) with PRL as described in panel C was determined as outlined in panel A. These cells were transduced with either control shRNA (blue squares) or shRNA against human PKM2 (all other symbols). Among the latter, cells received empty vector (black/gray triangles) or murine wild-type PKM2 (green diamonds) or murine PKM2KE mutant (red/orange circles). Average data from three independent experiments (each in triplicate) are presented as percent of number of initially seeded cells (±sd). Asterisks denote statistically significant differences (P < 0.05 by Student’s t test). F, The levels of expression of Flag-tagged PKM2 species in MCF7 cells described in panel E was analyzed by IB.

Similar articles

Cited by

References

    1. Clevenger CV, Furth PA, Hankinson SE, Schuler LA 2003 The role of prolactin in mammary carcinoma. Endocr Rev 24:1–27 - PMC - PubMed
    1. Clevenger CV, Zheng J, Jablonski EM, Galbaugh TL, Fang F 2008 From bench to bedside: future potential for the translation of prolactin inhibitors as breast cancer therapeutics. J Mammary Gland Biol Neoplasia 13:147–156 - PubMed
    1. Clevenger CV, Gadd SL, Zheng J 2009 New mechanisms for PRLr action in breast cancer. Trends Endocrinol Metab 20:223–229 - PubMed
    1. Carver KC, Arendt LM, Schuler LA 2009 Complex prolactin crosstalk in breast cancer: new therapeutic implications. Mol Cell Endocrinol 307:1–7 - PMC - PubMed
    1. Wagner KU, Rui H 2008 Jak2/Stat5 signaling in mammogenesis, breast cancer initiation and progression. J Mammary Gland Biol Neoplasia 13:93–103 - PubMed

Publication types

MeSH terms