. 2010 Oct 20;30(42):13983-91.
doi: 10.1523/JNEUROSCI.2040-10.2010.

The contribution of blood lactate to brain energy metabolism in humans measured by dynamic 13C nuclear magnetic resonance spectroscopy

Affiliations

The contribution of blood lactate to brain energy metabolism in humans measured by dynamic 13C nuclear magnetic resonance spectroscopy

Fawzi Boumezbeur et al. J Neurosci. .

Abstract

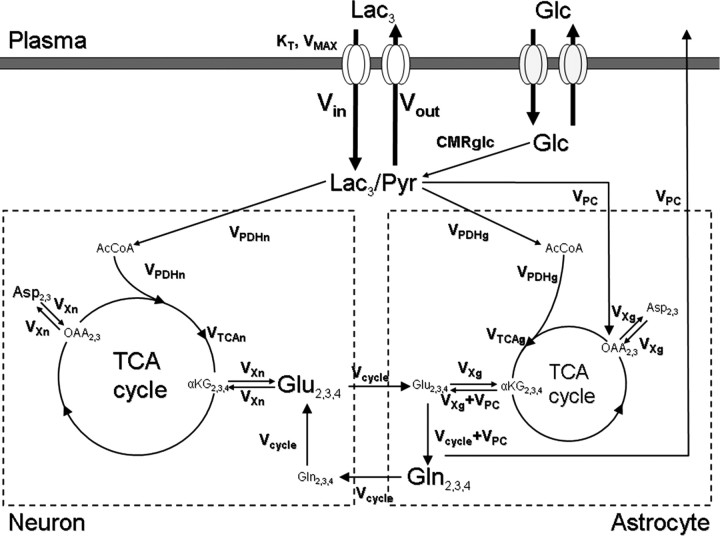
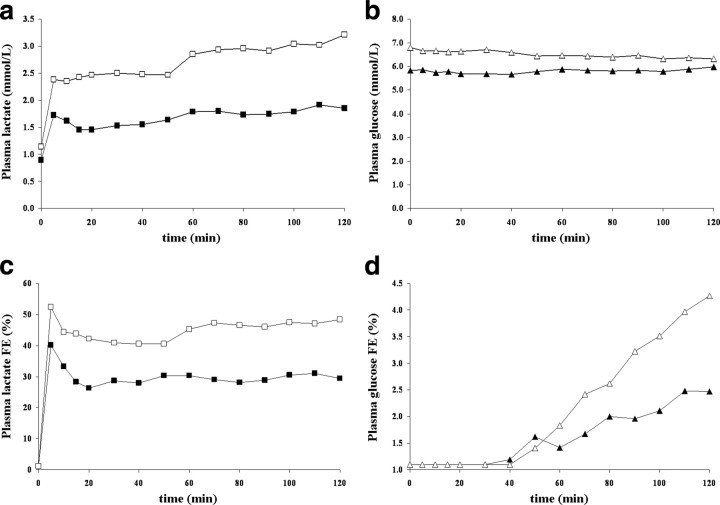
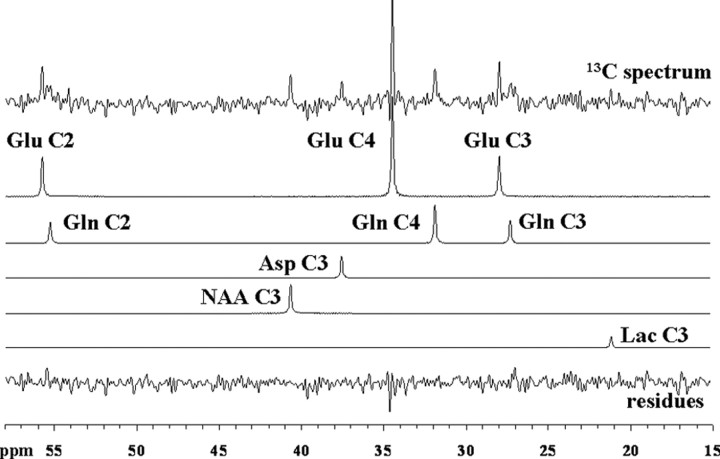
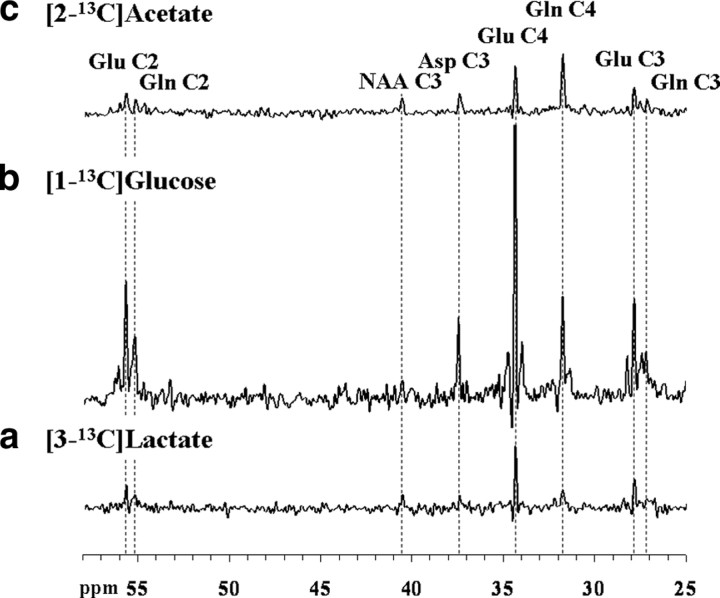
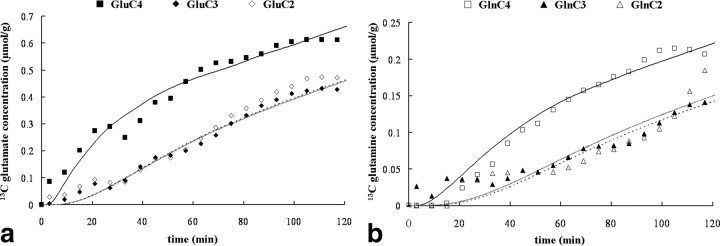
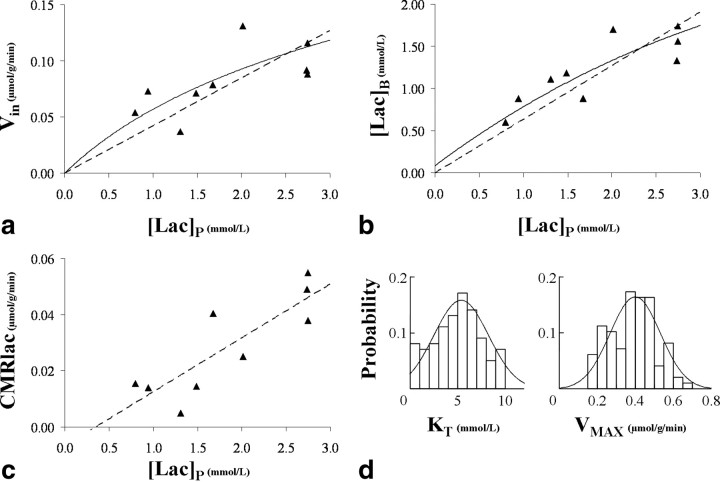
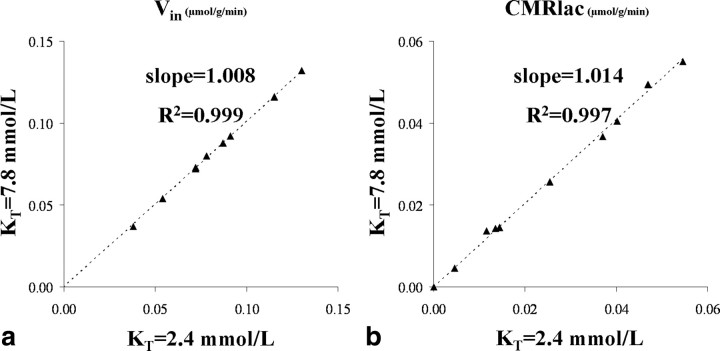
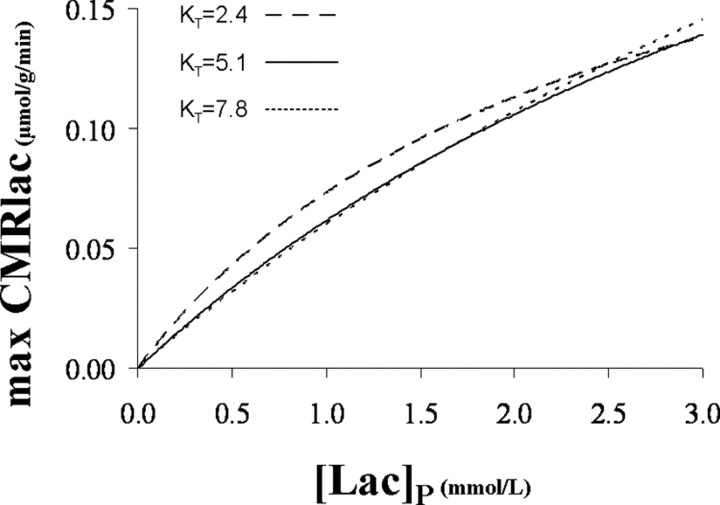
To determine whether plasma lactate can be a significant fuel for human brain energy metabolism, infusions of [3-(13)C]lactate and (1)H-(13)C polarization transfer spectroscopy were used to detect the entry and utilization of lactate. During the 2 h infusion study, (13)C incorporation in the amino acid pools of glutamate and glutamine were measured with a 5 min time resolution. With a plasma concentration ([Lac](P)) being in the 0.8-2.8 mmol/L range, the tissue lactate concentration ([Lac](B)) was assessed as well as the fractional contribution of lactate to brain energy metabolism (CMRlac). From the measured relationship between unidirectional lactate influx (V(in)) and plasma and brain lactate concentrations, lactate transport constants were calculated using a reversible Michaelis-Menten model. The results show that (1) in the physiological range, plasma lactate unidirectional transport (V(in)) and concentration in tissue increase close to linearly with the lactate concentration in plasma; (2) the maximum potential contribution of plasma lactate to brain metabolism is 10% under basal plasma lactate conditions of ∼1.0 mmol/L and as much as 60% at supraphysiological plasma lactate concentrations when the transporters are saturated; (3) the half-saturation constant K(T) is 5.1 ± 2.7 mmol/L and V(MAX) is 0.40 ± 0.13 μmol · g(-1) · min(-1) (68% confidence interval); and (4) the majority of plasma lactate is metabolized in neurons similar to glucose.


Figures

Figure 1.
Figure 1.
Two-compartment model describing the incorporation of label from [3-13C]lactate into the brain glutamate and glutamine pools. Left, Neuronal compartment; right, astroglial compartment. Lac, Lactate; Glc, glucose; Pyr, pyruvate; AcCoA, acetyl coenzyme A; OAA, oxaloacetate; αKG, α-ketoglutarate; Glu, glutamate; Gln, glutamine; Asp, aspartate; Vin, influx of lactate; Vout, efflux of lactate; CMRglc, glucose consumption; VPDHn, neuronal flux through the pyruvate dehydrogenase; VPDHg, astroglial flux through the pyruvate dehydrogenase; VTCAn, neuronal TCA cycle rate; VTCAg, astroglial TCA cycle rate; VPC, flux through the pyruvate carboxylase; Vcycle, glutamate/glutamine cycle flux; VXn, mitochondrial/cytosolic glutamate/α-ketoglutarate exchange rate in neurons; VXg, mitochondrial/cytosolic glutamate/α-ketoglutarate exchange rate in astrocytes. In our experiment, 13C-labeled lactate cross the blood–brain barrier back and forth through the monocarboxylate transporters (KT, VMAX) and arrives at the C3 of the lactate/pyruvate pool (regrouped as a unique pool because of the very fast exchange between them through the lactate dehydrogenase), where the label enters the TCA cycle via pyruvate carboxylase or pyruvate dehydrogenase reaction. It is ultimately detected at the first turn of the TCA cycle in the C4 position of glutamate and glutamine then, after label scrambling by the TCA activity, on the C2 and C3 positions of glutamate and glutamine.
Figure 2.
Figure 2.
a–d, Time courses of plasma lactate concentrations (a), glucose concentration (in millimoles per liter) (b), plasma lactate 13C fractional enrichment (FE) (c), and glucose 13C fractional enrichment (d) from the same volunteer for the two different infusion protocols A (black symbols) and B (white symbols). As aimed, plasma lactate level is either (protocol A) maintained close to a physiological level (∼1.5 mmol/L) with a 13C FE close to 33% or (protocol B) doubled (∼2.5 mmol/L) with a 13C FE close to 50%. Even if the plasma glucose level remains steady at euglycemic values, as the circulating [3-13C]lactate is metabolized by the liver, 13C atoms are progressively incorporated into the plasma glucose through gluconeogenesis.
Figure 3.
Figure 3.
Localized 13C spectrum acquired from the occipito-parietal lobe of a volunteer during the last 32 min of a 2 h [3-13C]lactate infusion study and its decomposition by LCModel. Singlets for GluC4, GluC3, GluC2, GlnC4, GlnC3, GlnC2, AspC3, LacC3, NAAC3, and the residues are displayed. For processing parameters, see Materials and Methods.
Figure 4.
Figure 4.
a–c, Localized 13C spectra acquired from the occipito-parietal lobe of the same volunteer either during the last 25 min of a 2 h [3-13C]lactate infusion study ([Lac]P ∼ 1.5 mmol/L and 13C FE ∼ 29%) (a, bottom), during the last 15 min of a 2 h [1-13C]glucose (b, middle), or the last 25 min of a 2 h [2-13C]acetate infusion (c, top), scaled to exhibit the differences in 13C fractional enrichment reached for glutamate and glutamine. For processing parameters, see Materials and Methods.
Figure 5.
Figure 5.
a, b, Time courses of glutamate (a) and glutamine (b) 13C concentrations for the C4, C3, and C2 positions from one of the subjects during the infusion of [3-13C]lactate ([Lac]P ∼ 2.7 mmol/L and 13C FE ∼ 50%). The glutamate and glutamine C4 labeling are represented by squares (closed and open, respectively), whereas the glutamate C3 and C2 labeling, by diamonds (closed and open, respectively), and glutamine C3 and C2 labeling, by triangles (closed and open, respectively). The lines are the fits obtained with the metabolic model (solid, C4; dashed, C3; shaded, C2 positions). The scale for glutamine is increased approximately by a factor of 3 to facilitate the visualization of the kinetics.
Figure 6.
Figure 6.
a, Lactate influx plotted as a function of the plasma lactate concentration. The dashed straight line represents the linear regression that has a slope of 0.042 and a R2 value of 0.58. b, Brain lactate as a function of the plasma lactate concentration. The dashed straight line represents the linear regression that has a slope of 0.63 and a R2 value of 0.75. For both a and b, the solid curve line represents the best fit obtained from a least-square minimization using expressions in Equations 5 and 8 given by the reversible Michaelis–Menten model. c, Lactate net consumption plotted as a function of the plasma lactate concentration. The dashed straight line represents the linear regression: CMRlac (in micromoles per gram per minute) = 0.019.[Lac]P-0.007, R2 = 0.72. d, Overlay of the probability density functions and corresponding histograms for KT and VMAX values derived from the Monte Carlo analysis (for details, see Materials and Methods) of the data presented in a and b: KT = 5.1 ± 2.7 mmol/L and VMAX = 0.40 ± 0.13 μmol · g−1 · min−1 (mean ± SD).
Figure 7.
Figure 7.
a, b, Lactate influx values (a) and net consumption of lactate (b) obtained from the dynamic modeling of the data assuming KT being either equal to the mean − SD = 2.4 or mean + SD = 7.8 mmol/L (as determined from the Monte Carlo simulations). The impact observed on the estimated Vin and CMRlac values is negligible as illustrated by the slopes (∼1.01) and R2 coefficients (>0.99) of the linear regressions.
Figure 8.
Figure 8.
Maximum lactate consumption versus plasma lactate concentration for the mean KT value, 5.1 mmol/L, and the values at the 68% CI, 2.4 and 7.8 mmol/L. For each KT value, the corresponding mean VMAX value was considered: 0.25, 0.38, and 0.50 μmol · g−1 · min−1 (Table 2).

Comment in

References

    1. Bachelard H. Landmarks in the application of 13C-magnetic resonance spectroscopy to studies of neuronal/glial relationships. Dev Neurosci. 1998;20:277–288. - PubMed
    1. Blüml S, Moreno-Torres A, Shic F, Nguy CH, Ross BD. Tricarboxylic acid cycle of glia in the in vivo human brain. NMR Biomed. 2002;15:1–5. - PubMed
    1. Boumezbeur F, Mason GF, de Graaf RA, Behar KL, Cline GW, Shulman GI, Rothman DL, Petersen KF. Altered brain mitochondrial metabolism in healthy aging as assessed by in vivo magnetic resonance spectroscopy. J Cereb Blood Flow Metab. 2010;30:211–221. - PMC - PubMed
    1. Bröer S, Schneider HP, Bröer A, Rahman B, Hamprecht B, Deitmer JW. Characterization of the monocarboxylate transporter 1 expressed in Xenopus laevis oocytes by changes in cytosolic pH. Biochem J. 1998;333:167–174. - PMC - PubMed
    1. Chen W, Zhu XH, Gruetter R, Seaquist ER, Adriany G, Uğurbil K. Study of tricarboxylic acid cycle flux changes in human visual cortex during hemifield visual stimulation using 1H-[13C] MRS and fMRI. Magn Reson Med. 2001;45:349–355. - PubMed

Publication types

MeSH terms

LinkOut - more resources