. 2010 Oct 20;30(42):13992-4007.
doi: 10.1523/JNEUROSCI.2126-10.2010.

Differential subcellular recruitment of monoacylglycerol lipase generates spatial specificity of 2-arachidonoyl glycerol signaling during axonal pathfinding

Affiliations

Differential subcellular recruitment of monoacylglycerol lipase generates spatial specificity of 2-arachidonoyl glycerol signaling during axonal pathfinding

Erik Keimpema et al. J Neurosci. .

Abstract

Endocannabinoids, particularly 2-arachidonoyl glycerol (2-AG), impact the directional turning and motility of a developing axon by activating CB(1) cannabinoid receptors (CB(1)Rs) in its growth cone. Recent findings posit that sn-1-diacylglycerol lipases (DAGLα/β) synthesize 2-AG in the motile axon segment of developing pyramidal cells. Coincident axonal targeting of CB(1)Rs and DAGLs prompts the hypothesis that autocrine 2-AG signaling facilitates axonal outgrowth. However, DAGLs alone are insufficient to account for the spatial specificity and dynamics of 2-AG signaling. Therefore, we hypothesized that local 2-AG degradation by monoacylglycerol lipase (MGL) must play a role. We determined how subcellular recruitment of MGL is temporally and spatially restricted to establish the signaling competence of 2-AG during axonal growth. MGL is expressed in central and peripheral axons of the fetal nervous system by embryonic day 12.5. MGL coexists with DAGLα and CB(1)Rs in corticofugal axons of pyramidal cells. Here, MGL and DAGLα undergo differential axonal targeting with MGL being excluded from the motile neurite tip. Thus, spatially confined MGL activity generates a 2-AG-sensing microdomain and configures 2-AG signaling to promote axonal growth. Once synaptogenesis commences, MGL disperses in stationary growth cones. The axonal polarity of MGL is maintained by differential proteasomal degradation because inhibiting the ubiquitin proteasome system also induces axonal MGL redistribution. Because MGL inactivation drives a CB(1)R-dependent axonal growth response, we conclude that 2-AG may act as a focal protrusive signal for developing neurons and whose regulated metabolism is critical for attaining correct axonal complexity.


Figures
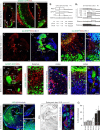
Figure 1.
Figure 1.
MGL localization in the developing nervous system. A–A2, MGL+ olfactory (A1, arrows) and thalamic axons (A2, arrows), ventricular zone progenitors (open arrowheads), and precursor cells populating the striatal differentiation zone (sdz) are present by E12.5. B, B1, Semiquantitative assessment of MGL distribution in postmitotic neurons of cerebral subfields. Incrementing horizontal line width correlates with increasing signal intensity. C–C3, Sagittal section across the brain and upper body segment of a homozygous tau–EGFP+ embryo photographed at E14.5 reveals MGL+ axons in the trigeminal ganglion (5Gn), submandibular trigeminal nerves (5man), and spinal trigeminal tract (sp5; C2), optic stalk (os), parabrachial/microcellular tegmental nuclei (PB/MiTg; C3), and thalamocortical (arrowheads) and olfactory tracts (1n). Open arrowheads indicate MGL+ subventricular zone progenitors. D–D4, MGL+ TCAs course in the inferior thalamic radiation (D1) before invading the cortical subplate (D2, arrows). D1, MGL+ axons at the anterodorsal thalamic boundary are intermingled with GABAergic neurons. D2, Radially migrating cortical neurons, presumed pyramidal cells, also express MGL. Note that GFP+ GABAergic interneurons are MGL at this developmental stage. D3, Brn-1+/tau–EGFP+ pyramidal cells (arrowheads) migrate through the MGL+ subplate to reach their final positions. D4, MGL+ puncta are in close apposition to tau–EGFP+ cortical neurons (arrowheads). E–E2, MGL+ axons populate the cortical IZ, hippocampal fimbria (f), lateral olfactory tract (lot), and optic nerves (och) by E16.5. Note that the striatal neuroepithelium (ne) lacks appreciable MGL expression. F, F1, By E18.5, MGL becomes restricted to neuronal perikarya and disappears from long-range axons. G, Increased [2-AG] coincides with MGL redistribution by birth. *p < 0.05 versus E14.5–E18.5 (Student's t test). Open rectangles denote the location of insets. Abbreviations used in all figures are listed in the supplemental information (available at www.jneurosci.org as supplemental material). Scale bars: A, A2, C–C2, D, E, F, 100 μm; A1, D1–D3, 25 μm; D4, E1, E2, F1, 10 μm.
Figure 2.
Figure 2.
Foci of MGL expression and the developmental dynamics of 2-AG signaling. A–D, Comparative analysis of the expression levels of 2-AG metabolic enzymes and CB1Rs in fetal mouse brain at E16.5. Data were normalized to GAPDH, a housekeeping gene. *p < 0.05, **p < 0.01, cortex versus thalamus. A′–D′, Cortical and thalamic neurons maintain region-specific differences in their expression of MGL, CB1R, and DAGLα/β after 4 DIV (n.f.e., normalized fold expression). E, The 33 kDa isoform of MGL predominates in fetal brain. E1, Western blot analysis of metabolic components of 2-AG signaling networks during successive stages of corticogenesis. β-III-Tubulin served as protein loading control. Discordant CB1R and CRIP1a expression patterns suggest a lack of interaction or temporally restricted CRIP1a recruitment to CB1Rs. E2, E3, Quantitative analysis of fetal DAGLα, MGL, and CB1R, CRIP1a protein levels. Data points represent mean ± SEM; integrated optical density values from n = 3 independent experiments. Neonatal cortices were used to normalize expression levels (*p < 0.05, **p < 0.01, Student's t test).
Figure 3.
Figure 3.
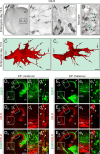
CB1Rs in corticofugal afferents. A, CB1R+ CFAs with their growth cones (A1, arrowheads) transiting into the internal capsule by E13.5. Note that all axons grow in the same direction when departing the neocortex (left to right with neocortex being on the left; A1). A1 is a photomontage of light micrographs merged from different focal planes. Arrowheads A1 and A2 indicate growth cones that were analyzed using electron microscopy and subsequent three-dimensional reconstruction. A2, Ultrastructural analysis of serial sections from a growth cone of a CB1R+ corticofugal axon (identified as 1 in A1) reveals anti-CB1R immunoperoxidase reaction end product in thick profiles and filopodial tips (double arrow). B, In the neocortical intermediate zone, the axon shaft (cross-section profile is encircled with red dotted line) contains numerous CB1Rs (visualized as silver-amplified immunogold particles; arrows) in small transport vesicles (highlighted semitransparent green) and on the plasmalemmal surface (open arrowheads). C, C1, Three-dimensional reconstruction of a growth cone reciprocally rotated ∼120°. Open arrows point to the truncated axon shaft. Note the numerous thin filopodia (double arrows) protruding in random directions. D1–E3, Axons of EGFP-expressing cortical (D1) but not thalamic neurons (E1) are CB1R+ at E16.5. In E1–E3, arrow identifies EGFP+ thalamocortical afferents residing in a spatially segregated CB1R fascicle in the subplate. CFA labeling denotes the location of corticofugal axons in d1–d3 and e1–e3. Filled (d1′–d3) but not open (e1′–e3) arrowheads identify individual EGFP+/CB1R+ axons of electroporated (EP) neurons. Scale bars: D3, E3, 500 μm; A, d3, e3, 100 μm; A, 10 μm; d3, e3, 3 μm; A1, B, 1 μm; A2, C, C1, 0.5 μm.
Figure 4.
Figure 4.
Differential colocalization of CB1Rs and MGL in the cerebral cortex and thalamus. A, Both MGL and CB1Rs are present in long-range forebrain axons. A1, Neocortical pyramidal cells are immunopositive for both MGL and CB1Rs. A2, In the intermediate zone, a subset of axonal profiles are dual labeled for MGL and CB1R. B–B1″, MGL+ axons were found abundant, whereas CB1R+ axonal profiles were infrequently encountered in thalamic territories. C, Relative area coverage of MGL+ and CB1R+ axons in the cerebral cortex and dorsal thalamus. C1, Colocalization coefficients for MGL and CB1R immunoreactivities reveal area-specific differences in their probability of colocalization. C2, Pearson's correlation coefficient of MGL/CB1R approximates 0 in both brain regions studied. D, The fimbria hippocampi comprises histochemical domains with distinct densities of MGL+ and CB1R+ axons. D1–D3, MGL concentrates in the dorsomedial fimbria, whereas CB1R+ axonal profiles predominate in its ventrolateral extension. D4, Colocalization coefficients for MGL+ and CB1R+ axons in fimbrial subterritories. *p < 0.05, **p < 0.01 (Student's t test). E, Working model of eCB-mediated CFA guidance with TCAs acting as ligand-inactivating barriers. Filled arrowheads denote colocalization, and open arrowheads show the lack thereof. Asterisks in (D1–D3) mark blood vessels. Scale bars: A, 500 μm; A1, A2, B, D1, 12 μm; A2 inset, B1, D1 inset, 3 μm.
Figure 5.
Figure 5.
DAGLα and MGL expression in CB1R−/− telencephalon. A, CB1Rs decorate corticofugal axons coursing in the cortical IZ and descending in fascicles through striatal patches. A1, Axonal CB1R immunoreactivity is entirely absent in CB1R−/− mice. B, B1, DAGLα expression is essentially unchanged in CB1R−/− brains in both the cerebral cortex and the hippocampal fimbria (B′, arrow). At cellular resolution, DAGLα localizes to radial glia fibers and enlarged axon clusters in the IZ of CB1R−/− mice (B1, arrows). C, C1, Similarly, CB1R deletion does not affect MGL expression in (C1) and targeting to (C1, arrows) axons in the cerebral cortex. Open rectangles identify the location of insets in A′–C1. Scale bars, 50 μm.
Figure 6.
Figure 6.
Differential subcellular targeting of DAGLα and MGL during axon development. A, A1, In primary cortical cultures, DAGLα and MGL are cotargeted to growing axons and often coexist in stable varicosities (B, arrowheads). During axon fasciculation (C) and postsynaptic targeting (D), DAGLα (Bisogno et al., 2003) but not MGL (arrowheads) is eliminated from axons and presynapses. D1, VAMP2 (synaptobrevin 2) was used to visualize presynaptic specializations. E, MGL is selectively trafficked into the quiescent premature axon (a) and accumulates in its proximal segment as soon as neuronal polarization commences. In neurites with looped growth cones (E1), fluorescence signal separation reveals mutually exclusive distribution of actin and MGL in motile axons (a; open rectangle) or dendrites (d). E2, MGL microgradients are invariably present in coexisting neurites with bundled (gc1), spread (gc2), or looped (gc3) growth cones. E3,E3, The presence of MGL in established axon segments and presynapse-like varicosities (arrows) is maintained in elaborate axonal meshworks in vitro. F, F1, Subcellular MGL and DAGLα targeting is strikingly different, with MGL being primarily excluded from the motile neurite tip (arrow). Arrowheads indicate the transition point between MGL+ and MGL domains. G, MGL immunofluorescence intensity measured in individual bundled/spread (left) or looped (right) growth cones (gcs) and adjoining distal axon segments. Individual fluorescence intensity plots are in gray, and average values are in blue/red. Scale bars: A–C1, D1, F–G1, 10 μm; E, 3 μm.
Figure 7.
Figure 7.
Proteasomal degradation excludes MGL from the motile neurite segment. A, Lactacystin increases MGL levels in primary cortical neurons. β-III-Tubulin (Tuj1) was used as loading control. Lactacystin stabilizes MGL in the lead neurite and eliminates its microgradient (C, C1) otherwise seen in control cells (B, B1; see also E5). Lactacystin disrupts axonal MGL targeting with stabilized MGL accumulating in both axonal (arrows) and dendritic (arrowheads) growth cones. B2–C3, MGL distribution in motile axon segments at high resolution. D, Fluorescence intensity plots reveal that proteasome inhibition significantly increases axonal MGL content. Individual and average fluorescence intensity plots are depicted in gray and blue/red colors, respectively. E, Lactacystin (24 h) does not compromise neuronal viability. However, lactacystin decreased the rate of axonal elongation (E1), inhibits axonal branching (E2), and increases the number of MGL+ axon collaterals (E3) without shortening or collapsing the motile neurite tip (E4). Lactacystin also suppressed dendritogenesis (F–H) and stabilized MGL ventures into proximal dendrites (G–G2, arrowheads, H1). **p < 0.01 (Student's t test); n = 15–20 cells per group. Scale bars: B1, C1, 20 μm; B3, C3, F2, G2, 10 μm.
Figure 8.
Figure 8.
Synaptogenesis coincides with subcellular MGL redistribution. A, A1, Postsynaptic target selection coincides with MGL redistribution along the axon and the growth cone (1; arrowheads). In the meantime, motile axon collaterals lack MGL (2 and 3; open arrowheads). Open rectangle indicates the position of B1–B3, showing MGL being present in the central growth cone domain but not filopodia (fil) as well as in a putative postsynaptic target (pst; arrowhead). Working model of the developmental functions of MGL (C) and its redistribution during synapse formation (C1). Scale bars: A, A1, 20 μm; B3, 2 μm.
Figure 9.
Figure 9.
MGL inhibition induces axonal growth. A, A1, JZL184 induces elongation of the primary neurite of cortical neurons (arrows) relative to controls. The initial point of axonal MGL gradients decrementing toward the actin+ growth cones is indicated by arrowheads. B–C2, JZL184-induced axonal elongation is unrelated to the time of drug exposure. Cortical neurons were seeded for short (B–B2) or prolonged (C–C2) periods and subsequently exposed to JZL184. MGL inhibition invariably evokes an axonal growth response (B1, C1). JZL184 does not affect either the length of the motile actin+ neurite tip (B2, C2). D–D3, DAGL inhibition by O-3841 as well as CB1R blockade by O-2050 abolishes JZL184-induced neurite outgrowth (F1) without affecting the number of neurites (F2). E1–E4, Both O-3841 and O-2050 markedly alleviate JZL184-induced growth cone collapse (G). Note that THL and O-3841 exert differential effects on growth cone size. *p < 0.05, **p < 0.01 (Student's t test); n = 25–40 cells per group. Scale bars: A1, D2, D3, 20 μm; E1–E4, 3 μm.

Similar articles

Cited by

References

    1. Aguado T, Monory K, Palazuelos J, Stella N, Cravatt B, Lutz B, Marsicano G, Kokaia Z, Guzmán M, Galve-Roperh I. The endocannabinoid system drives neural progenitor proliferation. FASEB J. 2005;19:1704–1706. - PubMed
    1. Aguado T, Palazuelos J, Monory K, Stella N, Cravatt B, Lutz B, Marsicano G, Kokaia Z, Guzmán M, Galve-Roperh I. The endocannabinoid system promotes astroglial differentiation by acting on neural progenitor cells. J Neurosci. 2006;26:1551–1561. - PMC - PubMed
    1. Begbie J, Doherty P, Graham A. Cannabinoid receptor, CB1, expression follows neuronal differentiation in the early chick embryo. J Anat. 2004;205:213–218. - PMC - PubMed
    1. Berghuis P, Dobszay MB, Wang X, Spano S, Ledda F, Sousa KM, Schulte G, Ernfors P, Mackie K, Paratcha G, Hurd YL, Harkany T. Endocannabinoids regulate interneuron migration and morphogenesis by transactivating the TrkB receptor. Proc Natl Acad Sci U S A. 2005;102:19115–19120. - PMC - PubMed
    1. Berghuis P, Rajnicek AM, Morozov YM, Ross RA, Mulder J, Urbán GM, Monory K, Marsicano G, Matteoli M, Canty A, Irving AJ, Katona I, Yanagawa Y, Rakic P, Lutz B, Mackie K, Harkany T. Hardwiring the brain: endocannabinoids shape neuronal connectivity. Science. 2007;316:1212–1216. - PubMed

Publication types

MeSH terms