. 2010 Oct 20;30(42):14173-81.
doi: 10.1523/JNEUROSCI.0945-10.2010.

Decision time, slow inhibition, and theta rhythm

Affiliations

Decision time, slow inhibition, and theta rhythm

Anteo Smerieri et al. J Neurosci. .

Abstract

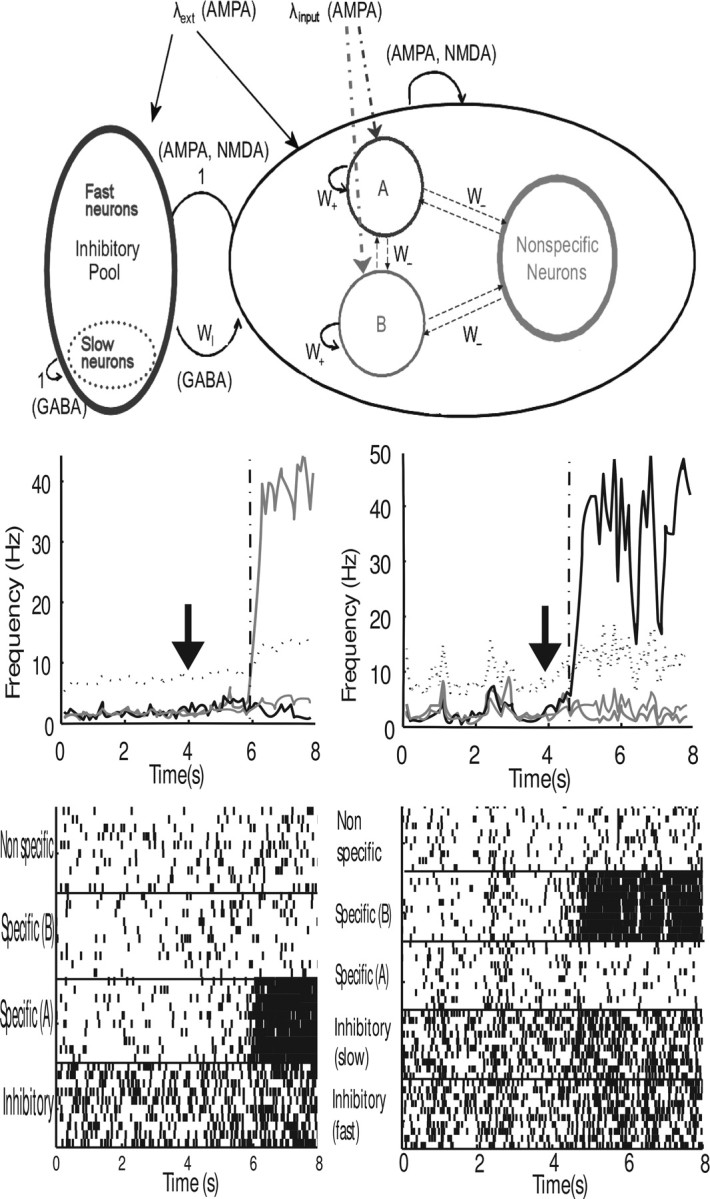
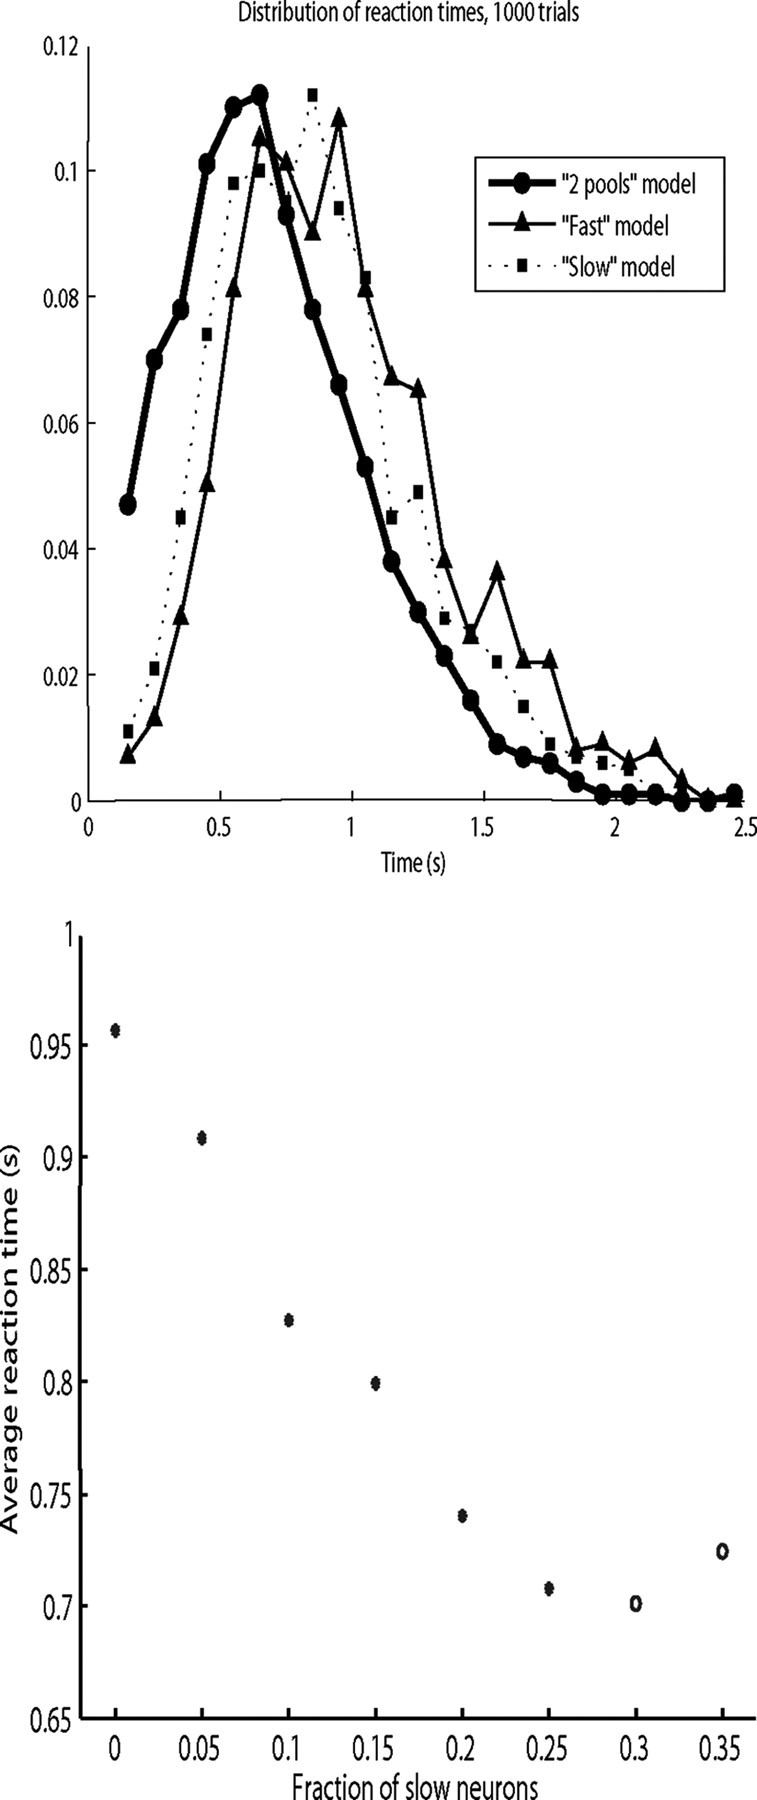
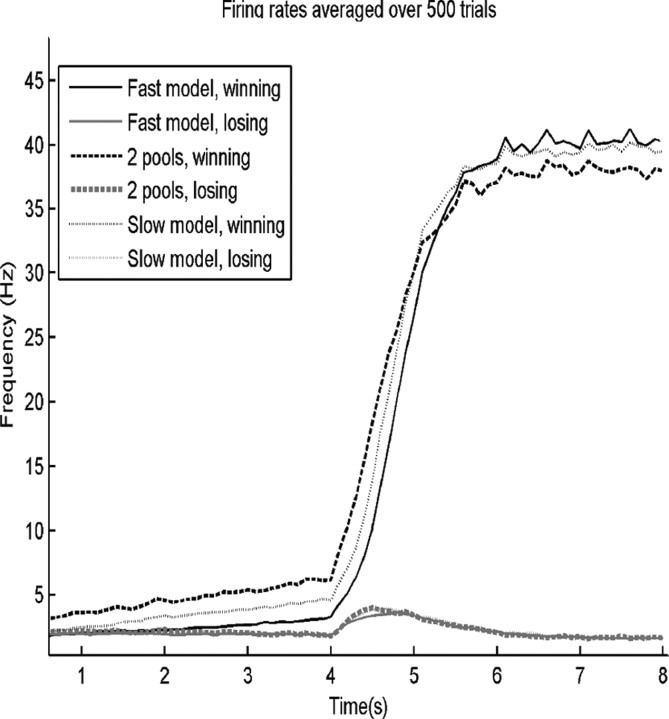
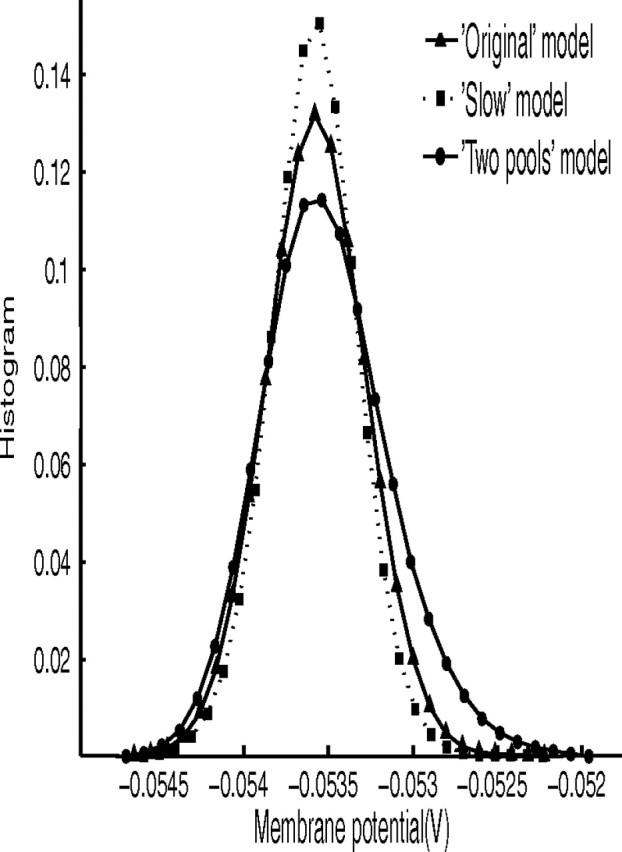
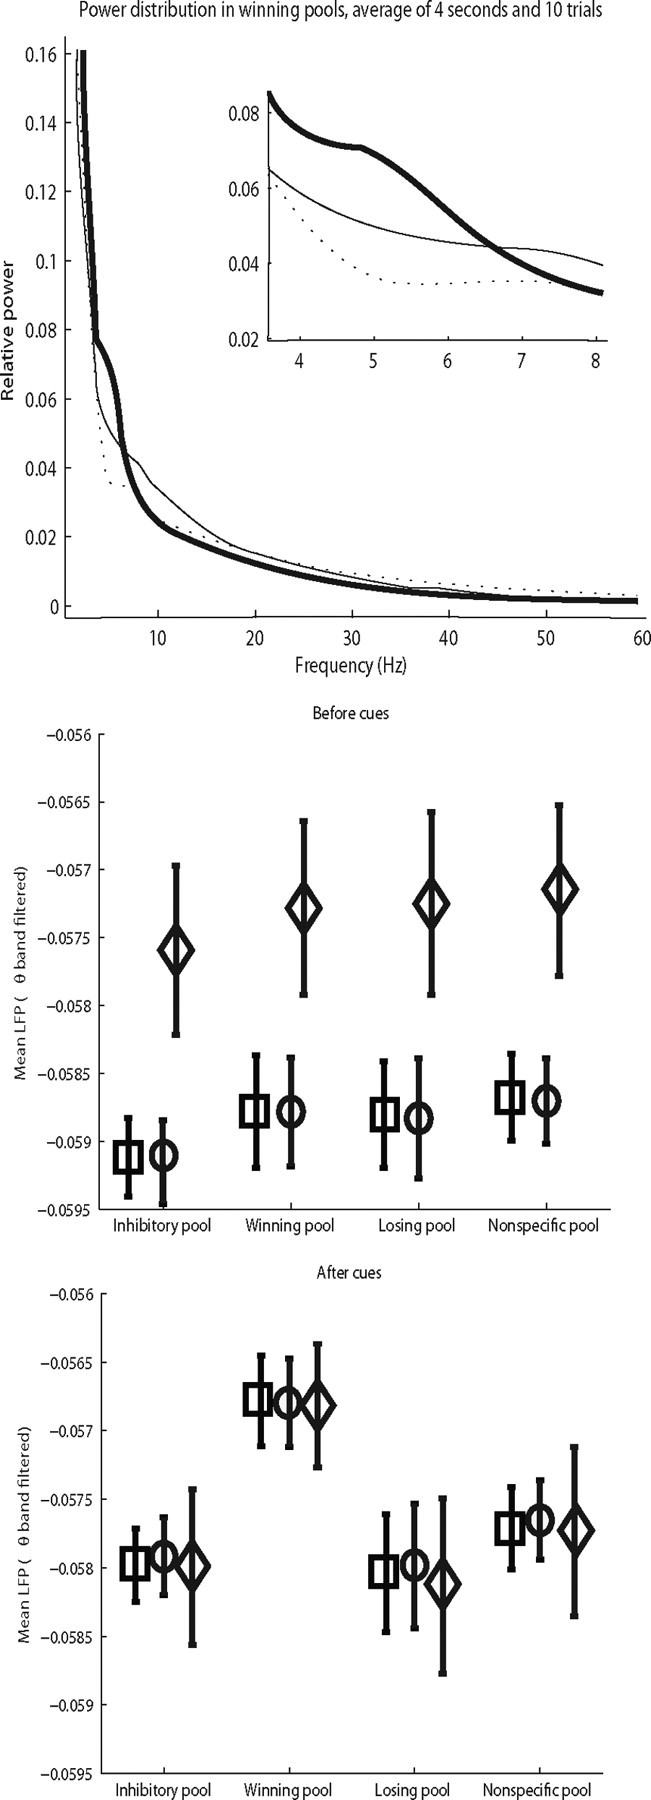
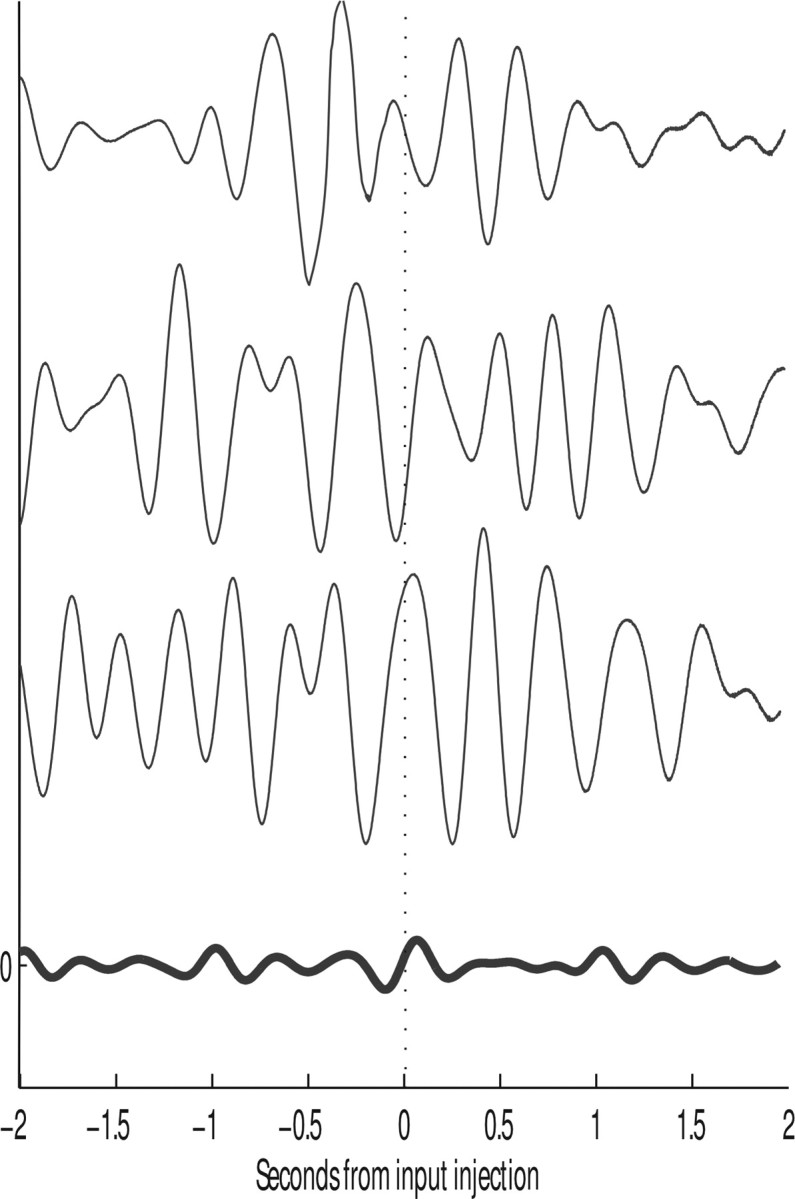
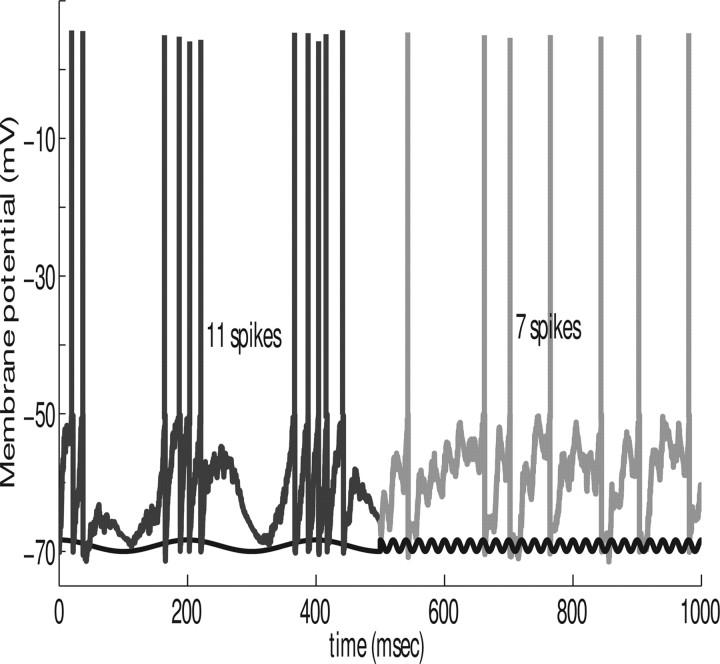
In this paper, we examine decision making in a spiking neuronal network and show that longer time constants for the inhibitory neurons can decrease the reaction times and produce theta rhythm. We analyze the mechanism and find that the spontaneous firing rate before the decision cues are applied can drift, and thereby influence the speed of the reaction time when the decision cues are applied. The drift of the firing rate in the population that will win the competition is larger if the time constant of the inhibitory interneurons is increased from 10 to 33 ms, and even larger if there are two populations of inhibitory neurons with time constants of 10 and 100 ms. Of considerable interest is that the decision that will be made can be influenced by the noise-influenced drift of the spontaneous firing rate over many seconds before the decision cues are applied. The theta rhythm associated with the longer time constant networks mirrors the greater integration in the firing rate drift produced by the recurrent connections over long time periods in the networks with slow inhibition. The mechanism for the effect of slow waves in the theta and delta range on decision times is suggested to be increased neuronal spiking produced by depolarization of the membrane potential on the positive part of the slow waves when the neuron's membrane potential is close to the firing threshold.


Figures

Figure 1.
Figure 1.
Top, Diagram of the two-pool network model used for the simulations. All connections from the excitatory neurons (the A, B, and nonspecific pools on the right) are AMPA- and NMDA-mediated. The fast and slow models have only one inhibitory pool, in which all the neurons have the same τGABA. The connections from inhibitory neurons shown on the left are GABA-mediated. The letters or numbers next to the arrows specify the synaptic weights. Middle, left, Firing rates for all the pools for sample trials of the original model. Thick gray line, specific pool A; thick black line, specific pool B; thin gray line, nonspecific pool; dotted black line, inhibitory fast pool; dotted gray line, inhibitory slow pool. Input cues are switched on at t = 4 s (arrows). The vertical dashed line marks the moment where the decision was taken, as measured by the criterion described in the text. Bottom, left, Rastergrams for the same two trials, showing the spiking activity for 10 randomly chosen neurons from each population. Middle and bottom, right, Same as with middle and bottom, left, but with the two-pool model.
Figure 2.
Figure 2.
Top, Distribution of the reaction times for the three different models. The distribution was measured using 1000 trials, and the distribution is shown with 100 ms bins. Circles, two-pool model; triangles, fast model; squares, slow model. Bottom, Two-pool model average reaction time as a function of the fraction of slow versus fast neurons in the inhibitory pool. Open circles mark the cases where the spontaneous state is unstable, i.e., the values for which >50% of the trials showed a transition to the decision state before the decision cues are applied. The point for a fraction = 0 corresponds to the fast or original model. The point for a fraction = 0.25 corresponds to the two-pool model.
Figure 3.
Figure 3.
Average firing rates for the winning and losing pools over 500 trials for the three models for ΔI = 0. The decision cues were started at 4 s. (Firing rates averaged over 500 trials, winning and losing).
Figure 4.
Figure 4.
Distribution of average membrane potentials Va values in the specialized winning pool before the cue injection for the three models, using 30 bins. Triangles, fast model; squares, slow model; circles, two-pool model.
Figure 5.
Figure 5.
Top, Power spectra as calculated from the continuous wavelet transform of the average membrane potential over the 1.5–100 Hz range. Inset, Detail of the spectra for the 4–8 Hz region. Individual spectra were taken by squaring and normalizing the CWT coefficients for each time point, then averaging the result over the whole 4 s of simulation. Data shown in the plot are the average of 10 such spectra for each model. Dotted line, fast model; thin line, slow model; thick line, two-pool model. Middle and bottom, Mean values and SDs of the theta-filtered average membrane potentials Va, before (middle) and after (bottom) the cue injection for all pools and for the three models. The values reported are the average across 200 trials for each model. Circles, fast model; squares, slow model; diamonds, two-pool model.
Figure 6.
Figure 6.
Three different trials, randomly chosen, of theta-filtered average membrane potentials Va obtained using the slow model (top three lines), and the average of the theta-filtered Va over 200 trials (bottom, thick line) for the same model, for 2 s of simulation before and after the input injection. No phase-reset phenomenon is discernible.
Figure 7.
Figure 7.
The membrane potential of a single integrate-and-fire neuron of the type specified in Equation 1 in response to currents applied as Isyn at slow (5 Hz) and at fast (50 Hz) frequencies and with identical amplitudes. The frequency was changed at time = 500 ms, and its time course is shown by the sinusoidal waveform (black line). The membrane time constant gL was 20 ms. The membrane potential shows a larger modulation with the low than with the high-frequency input. This effect is produced by the filtering effect produced by the membrane time constant, which acts as a low-pass filter, with smaller effects therefore produced by the higher frequency of 50 Hz. Depending on the average membrane potential produced by other inputs to the neuron, the larger modulation of the membrane potential produced by low frequencies may produce more action potentials with the low than with the high frequencies, as illustrated. In the case illustrated, the main input to the neuron was the sinusoidal input, and VL was −70 mV.

References

    1. Behrens TE, Hunt LT, Woolrich MW, Rushworth MF. Associative learning of social value. Nature. 2008;456:245–249. - PMC - PubMed
    1. Blake R, Logothetis NK. Visual competition. Nat Rev Neurosci. 2002;3:13–21. - PubMed
    1. Boorman ED, Behrens TE, Woolrich MW, Rushworth MF. How green is the grass on the other side? Frontopolar cortex and the evidence in favor of alternative courses of action. Neuron. 2009;62:733–743. - PubMed
    1. Broadbent DE. The magic number seven after fifteen years. In: Kennedy A, Wilkes A, editors. Studies in long term memory. New York: Wiley; 1975. pp. 3–18.
    1. Brunel N, Wang XJ. Effects of neuromodulation in a cortical network model of object working memory dominated by recurrent inhibition. J Comput Neurosci. 2001;11:63–85. - PubMed

Publication types

LinkOut - more resources