. 2010 Oct 20;30(42):14213-24.
doi: 10.1523/JNEUROSCI.2390-10.2010.

Experimental characterization and mathematical modeling of P2X7 receptor channel gating

Affiliations

Experimental characterization and mathematical modeling of P2X7 receptor channel gating

Zonghe Yan et al. J Neurosci. .

Abstract

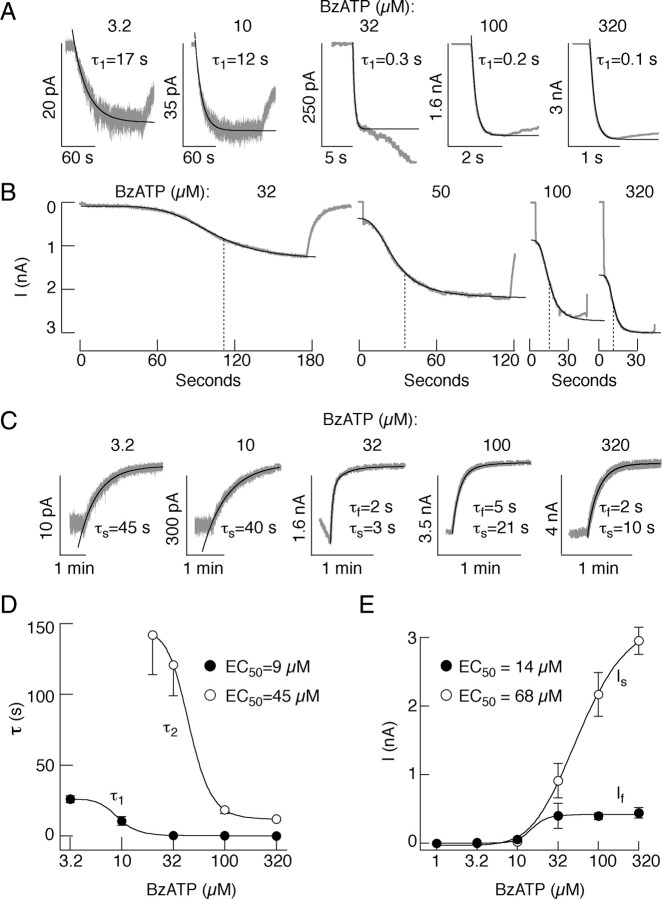
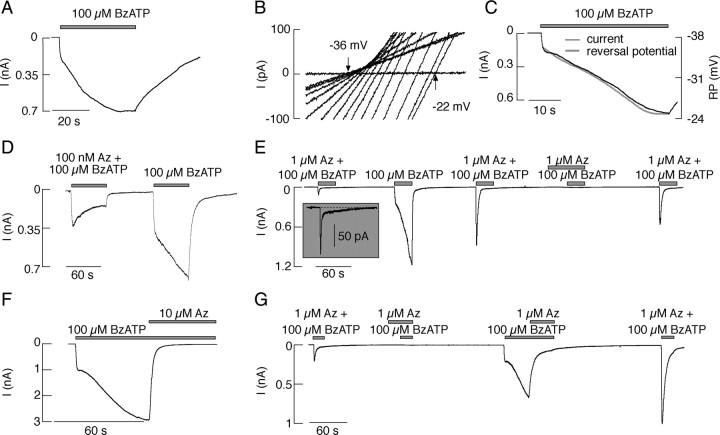
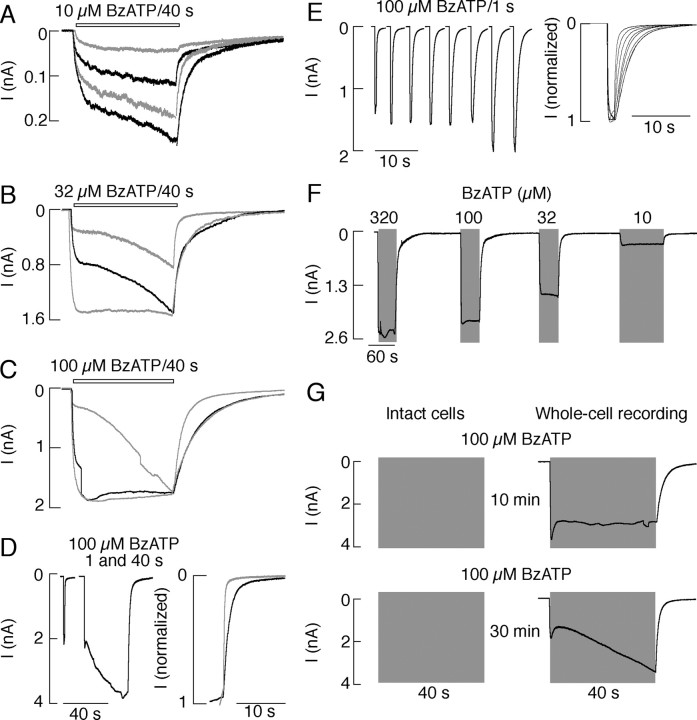
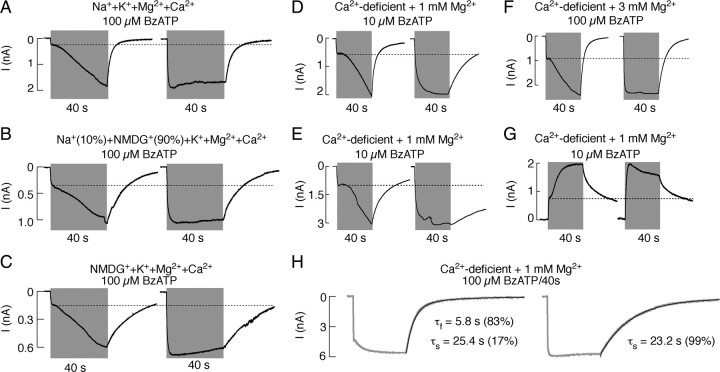
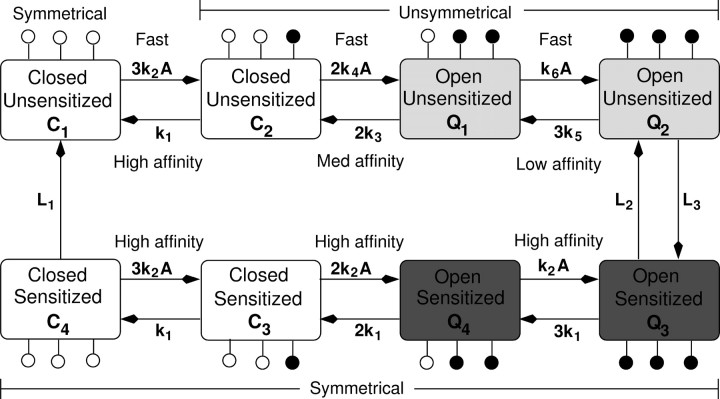
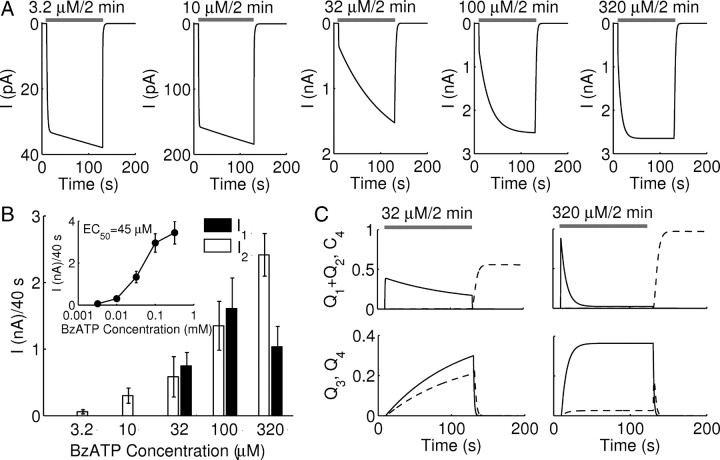
The P2X7 receptor is a trimeric channel with three binding sites for ATP, but how the occupancy of these sites affects gating is still not understood. Here we show that naive receptors activated and deactivated monophasically at low and biphasically at higher agonist concentrations. Both phases of response were abolished by application of Az10606120, a P2X7R-specific antagonist. The slow secondary growth of current in the biphasic response coincided temporally with pore dilation. Repetitive stimulation with the same agonist concentration caused sensitization of receptors, which manifested as a progressive increase in the current amplitude, accompanied by a slower deactivation rate. Once a steady level of the secondary current was reached, responses at high agonist concentrations were no longer biphasic but monophasic. Sensitization of receptors was independent of Na(+) and Ca(2+) influx and ∼30 min washout was needed to reestablish the initial gating properties. T15E- and T15K-P2X7 mutants showed increased sensitivity for agonists, responded with monophasic currents at all agonist concentrations, activated immediately with dilated pores, and deactivated slowly. The complex pattern of gating exhibited by wild-type channels can be accounted for by a Markov state model that includes negative cooperativity of agonist binding to unsensitized receptors caused by the occupancy of one or two binding sites, opening of the channel pore to a low conductance state when two sites are bound, and sensitization with pore dilation to a high conductance state when three sites are occupied.


Figures

Figure 1.
Figure 1.
Monophasic and biphasic activation of naive rat P2X7R expressed in HEK293 cells. A, B, Concentration-dependent effects of ATP (A) and BzATP (B) on receptor activation. In this and the following figures, current recordings were made in cells bathed in KR buffer containing 2 mm calcium and with Ca2+-deficient pipette medium containing 10 mm EGTA, and cells were held at −60 mV, if not otherwise specified. Traces shown are representative for at least five records per dose. Gray areas indicate duration of agonist application. I1, the primary current; I2, the secondary current. Notice that the current scales are variable, and that there is a transient decline of the I1 in response to 100 and 320 μm BzATP application. C, Concentration dependence of ATP (open circles) and BzATP (closed circles) on the peak amplitude of current reached during 40 s stimulation. D, Concentration dependence of the I1 and I2 amplitudes on BzATP, the second measured after 40 s agonist application. In C and D, data shown are means ± SEM from at least 5 records per dose, each performed in separate cells during initial agonist application. E, Concentration-dependent effect of BzATP on the rate of calcium influx and the peak amplitude of calcium signals in GT1 cells expressing recombinant P2X7R. Ca1 and Ca2, the primary and secondary response. Traces shown are representative from at least 20 records per dose.
Figure 2.
Figure 2.
Activation kinetics of P2X7R. A, Single exponential fitting of the I1 activation phase. Notice a progressive decrease in the time constant (τ1) derived from monoexponential fittings with elevation in BzATP concentration. B, The four parameters logistic curve fitting of the I2 rising phase. Vertical dotted lines indicate the calculated half-time constants (τ2). C, Mono- and biexponential fitting of deactivation of P2X7R after washout of BzATP. τf, fast deactivation time constants; τs, slow deactivation time constants. In A–C, representative traces are shown; gray traces indicate experimental records and black lines the fitted curves. D, E, Concentration-dependent effects of BzATP on the activation time constants (D) and on the Is and If amplitudes derived from deactivation fittings (E); mean ± SEM values from at least 5 records per dose.
Figure 3.
Figure 3.
Effects of substitution of bath sodium with NMDG and addition of a P2X7R-specific antagonist on the pattern of agonist-induced current responses. A–C, Permeability of the P2X7R pore to NMDG during the sustained agonist application. Pattern of 100 μm BzATP-induced current (A) and reversal potential (B) in cells bathed in sodium-deficient/NMDG-containing Krebs–Ringer buffer during the initial agonist application. Voltage-ramps from −80 mV to +80 mV twice per second during 40 s application were used to generate voltage-current curves. Only selected traces are shown. C, Comparison of kinetics of the secondary current growth (black trace) and changes in the reversal potential (RP, gray trace) during 40 s application of BzATP. D–G, Concentration-dependent effect of Az10606120 (Az) on 100 μm BzATP-induced current response in cells bathed in Krebs–Ringer buffer. D, Time course of activation and deactivation of receptors in the presence (left) and absence (right) of 100 nm Az10606120. E, G, Repetitive stimulation of cells with 100 μm BzATP in the presence and absence of 1 μm Az10606120. Inset shows the magnified first current response; notice the presence of the residual current during sustained application of agonist and antagonist. F, Abolition of both I1 and I2 by 10 μm Az10606120, with kinetics comparable to that observed during the washout of agonist (E, second application). In all panels, horizontal bars indicate duration of treatments.
Figure 4.
Figure 4.
Receptors sensitize during repetitive agonist application. A–C, Time-dependent increase in the peak amplitude of current and a decrease in the rate of receptor deactivation in cells stimulated repeatedly with 10 μm (A) 32 μm (B), and 100 μm (C) BzATP for 40 s. For clarity, every second trace is shown as gray. D, A difference in the rate of receptor deactivation caused by short (1 s) and prolonged (40 s) stimulation with BzATP. E, A decrease in the rate of receptor deactivation was induced by repetitive short (1 s) application of BzATP followed by 2 min washout periods. F, Sensitized receptors respond with monophasic currents during the subsequent application of BzATP, with the peak amplitude of current determined by agonist concentration. G, Duration of the sensitized state after the washout of agonist. Intact cells ready to be patched were initially stimulated with 100 μm BzATP for 40 s (left) followed by washout period of variable times. Before the secondary agonist application, the whole-cell patch clamp was established and current response was recorded. The response of cells after the washout period of 10 min (top) and 30 min (bottom) are shown.
Figure 5.
Figure 5.
Sensitization of receptors is independent of bath sodium and calcium. A–C, Cells were bathed in KR buffer containing Na+, K+, Mg2+ and Ca2+ (A), and in KR buffer in which 90% (B) or 100% (C) of Na+ was replaced by NMDG, with a pipette solution containing 10 mm EGTA. Left, Biphasic responses observed during the initial agonist application. Right, High amplitude monophasic responses were always observed during the second application of 100 μm BzATP after 2 min washout periods. D, E, Transition from biphasic to high amplitude monophasic current responses was observed in cells bathed in Ca2+-deficient KR buffer with the pipette medium containing 10 mm EGTA (D) or 5 mm BAPTA (E). In both experiments cells were clamped at −60 mV. F, G, Sensitization of receptors was also observed in cells bathed in medium in which Ca2+ was substituted with Mg2+ (F), as well as in cells containing 1 mm Mg2+ and clamped at +60 mV (G). In both experiments, the pipette medium contained 10 mm EGTA. H, In Ca2+-deficient medium and with pipette medium containing 10 mm EGTA, transition from biphasic to high amplitude monophasic currents was also accompanied with slower rate of deactivation. Because of the drop in the divalent cation concentrations in experiments shown in D, E, and G, 10 μm BzATP was used.
Figure 6.
Figure 6.
Dependence of P2X7R sensitization on the N-terminal structure. A–C, Characterization of the K17A (A), T15K (B), and T15E (C) mutants. The T15K and T15E mutants instantaneously opened with the dilated state, as indicated by the value of the reversal potential and the lack of a positive shift during prolonged agonist application. In contrast, the K17A mutant dilates gradually during the initial agonist application, as indicated by the rightward shift in the reversal potential (left). Similar records have been shown previously (Yan et al., 2008). Three mutants differed in their deactivation time kinetics during the short (1 s) and prolonged (2× 40 s) stimulation. Notice the slow deactivation of T15K and T15E mutants and the lack of changes in the rate of receptor deactivation after secondary agonist application, in contrast to the K17A mutant. D, Concentration-dependent effects of BzATP on the rate of T15E mutant receptor activation, which shows the lack of the secondary current growth in all BzATP concentrations.
Figure 7.
Figure 7.
Markov state cell model describing the sequence of binding/unbinding and sensitization/loss-of-sensitization events of P2X7Rs in a cell. The states Ci (closed channel pore) and Qi (open channel pore), i = 1, 2, 3, 4, represent the fraction of receptors in a given state. White (black) circles on each state indicate unoccupied (occupied) binding sites (3 in total) on the receptors of that state. The upper row corresponds to the unsensitized (undilated channel pore) states, while the bottom row corresponds to the sensitized states (open ones are dilated). ki, i = 1, 2,… , 6 and Li, i = 1, 2, 3, are the transition rates between the different states and A is the agonist concentration (BzATP or ATP). The gating variables and reversal potentials of Q1 (Q3) and Q2 (Q4) are the same (Table 1).
Figure 8.
Figure 8.
Current responses to increasing doses of agonist concentration according to the Markov state cell model, Equations 1–9. A, Current simulations obtained from the cell model upon 3.2, 10, 32, 100, and 320 μm/2 min BzATP stimulation. B, Average amplitudes of the fast, I1, and slow, I2, currents in response to 40 s agonist (BzATP) stimulation of a heterogeneous population of n = 10 cell models, randomly generated using the normal and uniform distributions according to Table 1. Notice the monodirectional dose dependence of I1 and bidirectional dose dependence of I2 on BzATP. Inset, Dose–response curve of the total current I (= I1 + I2) after 40 s stimulation with 3.2, 10, 32, 100, and 320 μm BzATP; mean ± SEM values from 10 model cells per dose. The estimated EC50 obtained from these stimulations is 45 μm. C, D, The time evolution of the states Q1 + Q2 (solid, top), C4 (dashed, top), Q3 (solid, bottom) and Q4 (dashed, bottom) are shown during 40 s stimulation with 32 μm (C) and 320 μm (D) BzATP.
Figure 9.
Figure 9.
Simulated current responses to repeated application of BzATP using the Markov state cell model and Equation 9. A–C, Simulations of periodic stimulation with 10 μm/40 s BzATP (A), 32 μm/40 s BzATP (B), and 100 μm/40 s BzATP (C). D, Simulation of model cell initially stimulated with 100 μm BzATP for 1 s followed by 40 s stimulation (left). Deactivation components of each pulse normalized by the maximum current amplitude are displayed on the right. E, Simulation model cell periodically stimulated with 100 μm/1 s BzATP (left). Deactivation components of each pulse normalized by the maximum current amplitude are displayed on the right. F, Current simulation from a model cell initially stimulated for 40 s with 320 μm BzATP followed by 40 s stimulation with 100, 32 and 80 s stimulation with 10 μm BzATP. As observed in the experiment, stimulation with 320 μm BzATP for 40 s led to receptor sensitization and monodirectional type of current response during BzATP stimulation applied later at lower doses, a behavior not exhibited by naive receptors.

References

    1. Bean BP, Williams CA, Ceelen PW. ATP-activated channels in rat and bullfrog sensory neurons: current–voltage relation and single-channel behavior. J Neurosci. 1990;10:11–19. - PMC - PubMed
    1. Becker D, Wolterdorf R, Boldt W, Schmitz S, Braam U, Schmalzing G, Markardt F. The P2X7 carboxyl tail is a regulatory module of P2X7 receptor channel activity. J Biol Chem. 2008;283:25725–25734. - PubMed
    1. Chessell IP, Grahames CBA, Michel AD, Humphrey PPA. Dynamics of P2X7 receptor pore dilation: pharmacological and functional consequences. Drug Dev Res. 2001;53:60–65.
    1. Di Virgilio F, Ferrari D, Adinolfi E. P2X(7): a growth-promoting receptor—implications for cancer. Purinergic Signal. 2009a;5:251–256. - PMC - PubMed
    1. Di Virgilio F, Ceruti S, Bramanti P, Abbracchio MP. Purinergic signalling in inflammation of the central nervous system. Trends Neurosci. 2009b;32:79–87. - PubMed

Publication types

MeSH terms