. 2010 Oct 20;30(42):14255-60.
doi: 10.1523/JNEUROSCI.2747-10.2010.

Pyramidal cells in piriform cortex receive convergent input from distinct olfactory bulb glomeruli

Affiliations

Pyramidal cells in piriform cortex receive convergent input from distinct olfactory bulb glomeruli

Alfonso Apicella et al. J Neurosci. .

Abstract

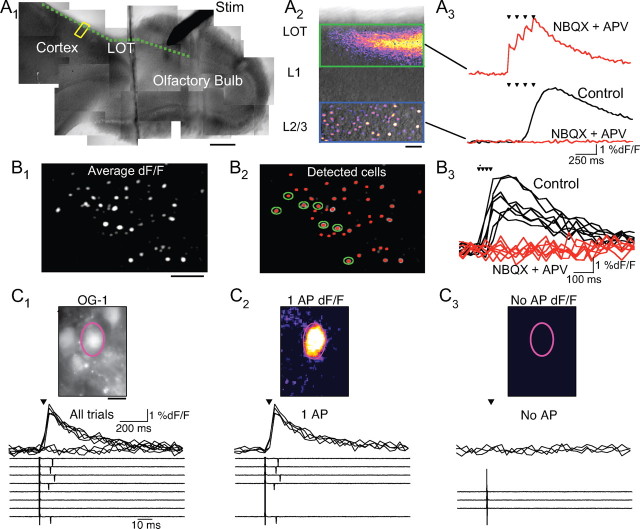
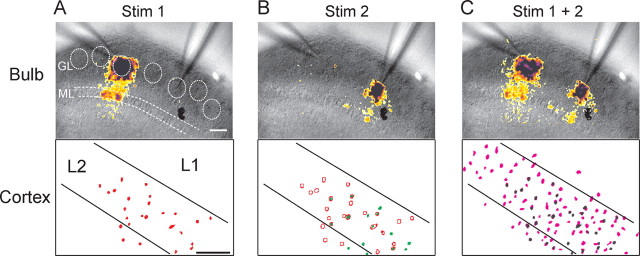
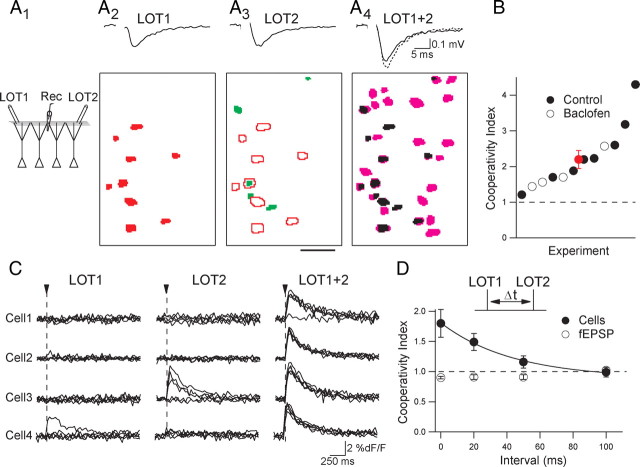
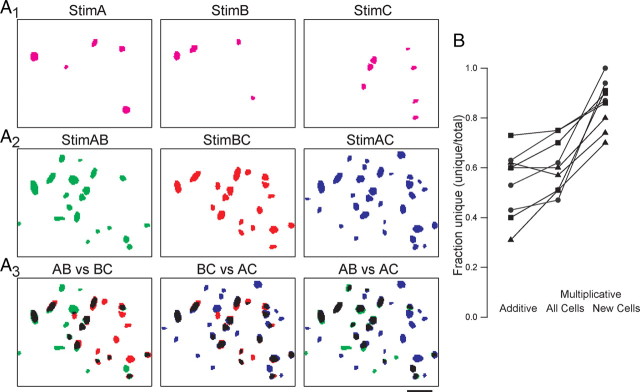
Pyramidal cells in piriform cortex integrate sensory information from multiple olfactory bulb mitral and tufted (M/T) cells. However, whether M/T cells belonging to different olfactory bulb glomeruli converge onto individual cortical cells is unclear. Here we use calcium imaging in an olfactory bulb-cortex slice preparation to provide direct evidence that neurons in piriform cortex receive convergent synaptic input from different glomeruli. We show that the combined activity of distinct glomerular pathways recruits ensembles of pyramidal cells that are not activated by the individual pathways alone. This cooperative recruitment of cortical neurons only occurs over a narrow time window and is a feature intrinsic to the olfactory cortex that can be explained by the integration of converging, subthreshold synaptic input. Cooperative recruitment enhances the differences between cortical representations of partially overlapping input patterns and may contribute to the initial steps of olfactory discrimination.


Figures

Figure 1.
Figure 1.
Visualizing cortical ensembles activated by mitral cells in olfactory bulb–cortex slices. A1, A stimulating electrode (Stim) is in the mitral cell layer and the dashed line is the route of the LOT. Scale bar, 200 μm. A2, DIC image of the region of cortex outlined in A1. Superimposed is the peak dF/F response of the cell layer region (blue box) in response to a stimulus train (4 pulses, 10 Hz) delivered to the mitral cell layer under control conditions and the response in layer 1 (green box) in the presence of NBQX and APV. Scale bar, 50 μm. A3, Bottom traces, Field dF/F response of the cell layer region before (black) and after (red) addition of NBQX (10 μm) and APV (50 μm). Top trace, Response in layer 1 in the presence of glutamate antagonists. Arrowheads indicate stimulus train. B1, Average dF/F image of layer 2/3 from five trials of stimulation in the olfactory bulb. Scale bar, 50 μm. B2, Activity map (red) overlaid on dF/F image showing detected cells. B3, Single-trial dF/F traces of cells outlined in B2 before (black) and after (red) application of glutamate receptor antagonists. C1, Top, OG-1 labeled cells in L2/3. The outlined cell was targeted for loose-patch recording. Scale bar, 12.5 μm. Middle, LOT stimulation (arrowhead) evoked calcium transients in 5/8 trials. Bottom, Simultaneously loose patch recording revealed APs in 5/8 trials. C2, Top, Average dF/F from the field in C1 for all trials in which an AP was detected. Middle and bottom, All trials in which the cell fired an action potential coincided with a calcium transient. C3, Top, Average dF/F for trials with no APs. Middle and bottom, Trials in which the cell did not fire an AP coincided with a lack of a calcium transient.
Figure 2.
Figure 2.
Cooperative recruitment of cortical neurons in response to stimulation of distinct olfactory bulb glomeruli. Sequential imaging of peak dF/F responses to stimulation in the olfactory bulb glomerular layer (top) and cell activity maps in piriform cortex (bottom) are shown. A, Focal stimulation in one glomerular region (Stim1) activates an ensemble of cells in cortex (red). B, Focal stimulation of a different glomerular region (Stim2) activates another ensemble of cells (green) some of which were also activated by Stim1 (open circles are cells from A). C, Simultaneous stimulation of the two glomerular regions (Stim1 + 2) recruits a large ensemble of cells that were not activated by each pathway alone (black cells). Scale bar, 100 μm.
Figure 3.
Figure 3.
Cooperative recruitment of cells in isolated slices of piriform cortex. A1, Schematic of stimulating electrodes (LOT1 and LOT2) and field recording electrode. A2, Average EPSP (top) of the trials used to make the cortical activity map (bottom) in response to stimulation of LOT1. A3, EPSP and activity map (green) in response to stimulation of the LOT2 pathway. Cells responding to LOT1 are superimposed (red outlines). A4, EPSP evoked by stimulation of LOT1 + 2 superimposed with the sum of the individual EPSPs (dotted trace). Cells recruited by coincident stimulation (magenta) are superimposed with those evoked independently by the two pathways (black). Scale bar, 50 μm. B, Summary of the cooperative recruitment of cells under control conditions (filled circles, n = 8) and in the presence of baclofen (50 μm, open circles, n = 4). Average value from all experiments shown in red. C, Individual kinetic plots of dF/F from four cells in one experiment (5 consecutive trials per cell). Arrowhead indicates LOT stimulation. D, Summary of the linearity of EPSPs (open circles) and cell ensembles (filled circles) in response to different LOT stimulus intervals (n = 6 slices). The supralinear response of pyramidal cells is fitted with an exponential (τ = 40 ms).
Figure 4.
Figure 4.
Cooperative recruitment of pyramidal cells enhances the difference between cell ensembles representing different input combinations. A1, Cell ensembles activated by stimulation of three different LOT pathways. A2, Cooperative responses to each of the three possible combinations of inputs. A3, Overlay of all input combinations reveals cells that are unique to each combination. Cells that are common to each pairwise combination are shown in black. Scale bar, 50 μm. B, Results from three experiments (different symbols) plotting the unique fraction of each input combination (Stim AB, BC, AC). The unique fraction of each combination is first plotted as the sum of the independent pathways (Additive). The unique fraction of the cell ensembles is greater when the pathways were stimulated simultaneously (Multiplicative, All Cells). The cells selectively recruited with simultaneous stimulation were the most unique for each input combination (Multiplicative, New Cells).

References

    1. Balu R, Pressler RT, Strowbridge BW. Multiple modes of synaptic excitation of olfactory bulb granule cells. J Neurosci. 2007;27:5621–5632. - PMC - PubMed
    1. Bathellier B, Margrie TW, Larkum ME. Properties of piriform cortex pyramidal cell dendrites: implications for olfactory circuit design. J Neurosci. 2009;29:12641–12652. - PMC - PubMed
    1. Cang J, Isaacson JS. In vivo whole-cell recording of odor-evoked synaptic transmission in the rat olfactory bulb. J Neurosci. 2003;23:4108–4116. - PMC - PubMed
    1. Davison IG, Katz LC. Sparse and selective odor coding by mitral/tufted neurons in the main olfactory bulb. J Neurosci. 2007;27:2091–2101. - PMC - PubMed
    1. Duchamp-Viret P, Duchamp A, Chaput MA. Single olfactory sensory neurons simultaneously integrate the components of an odour mixture. Eur J Neurosci. 2003;18:2690–2696. - PubMed

LinkOut - more resources