. 2010 Oct 20;30(42):14261-72.
doi: 10.1523/JNEUROSCI.2979-10.2010.

Laminar-specific maturation of GABAergic transmission and susceptibility to visual deprivation are related to endocannabinoid sensitivity in mouse visual cortex

Affiliations

Laminar-specific maturation of GABAergic transmission and susceptibility to visual deprivation are related to endocannabinoid sensitivity in mouse visual cortex

Bin Jiang et al. J Neurosci. .

Abstract

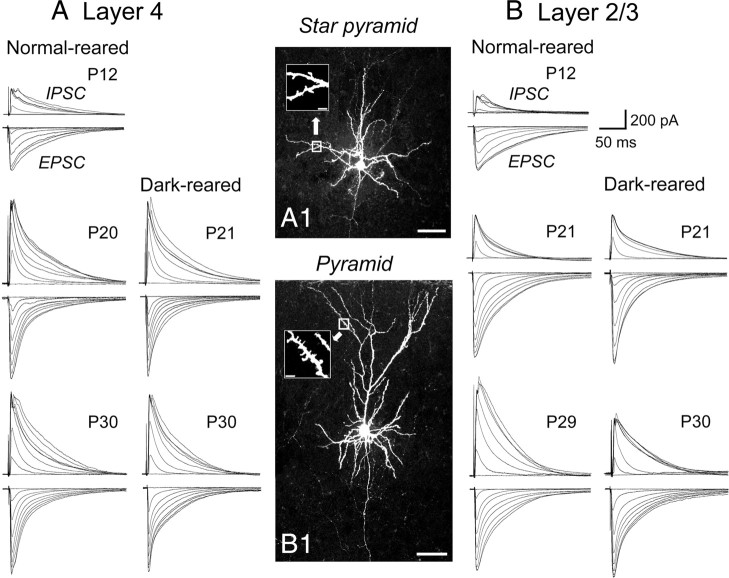
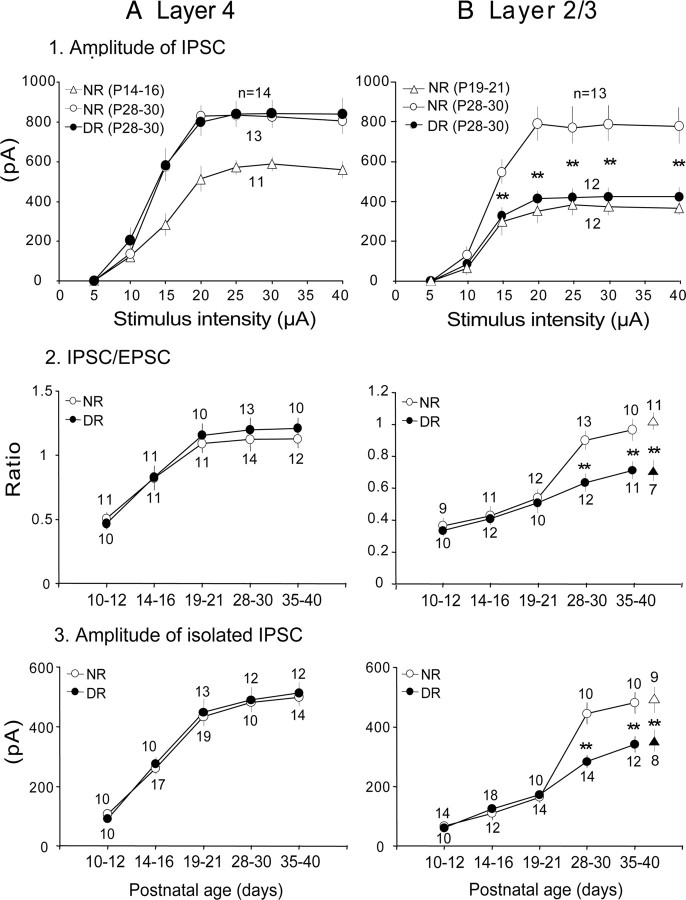
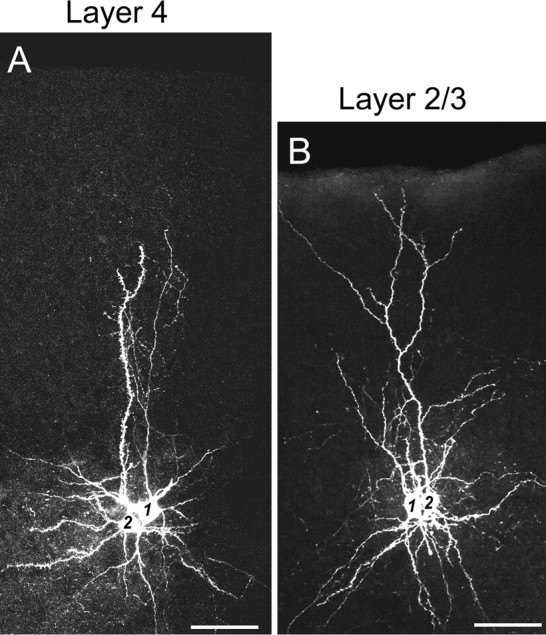
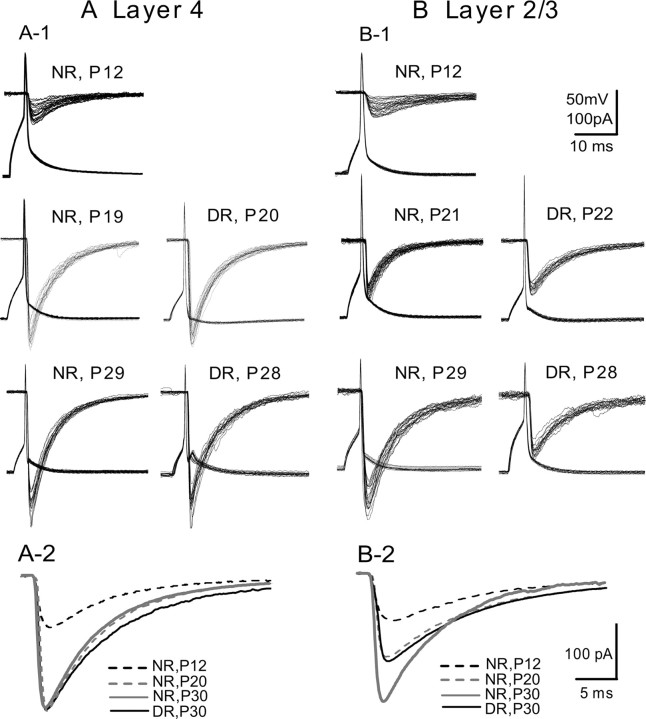
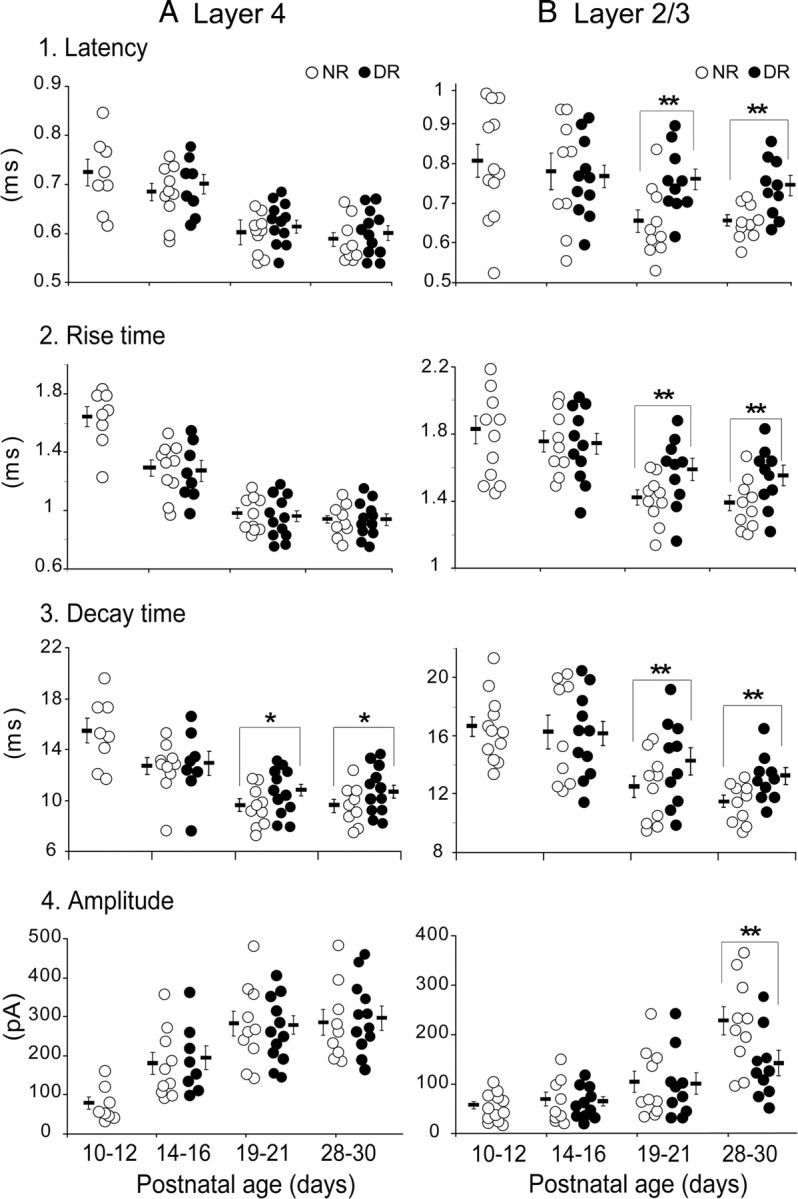
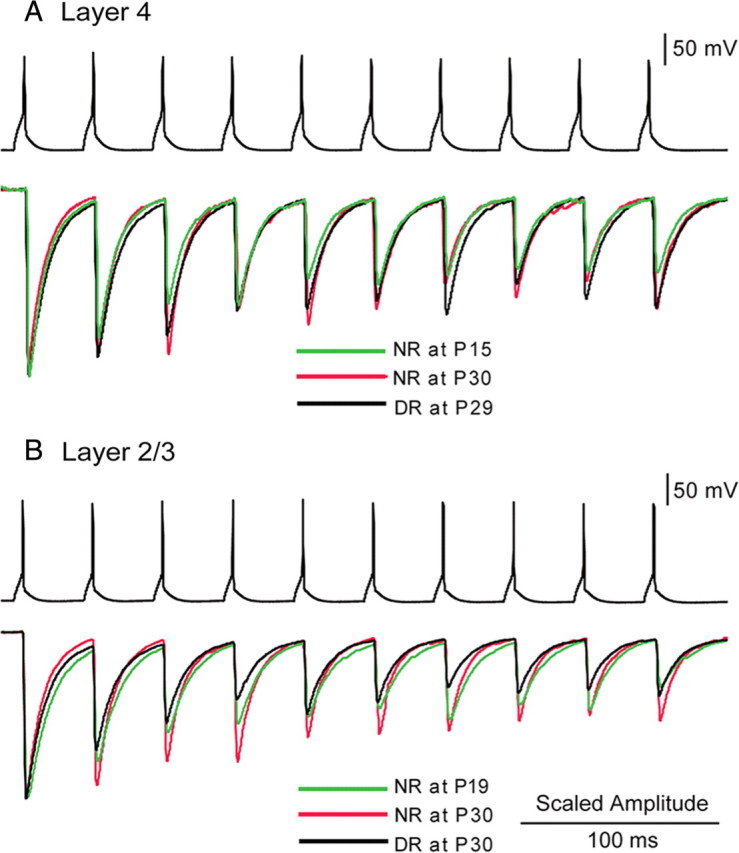
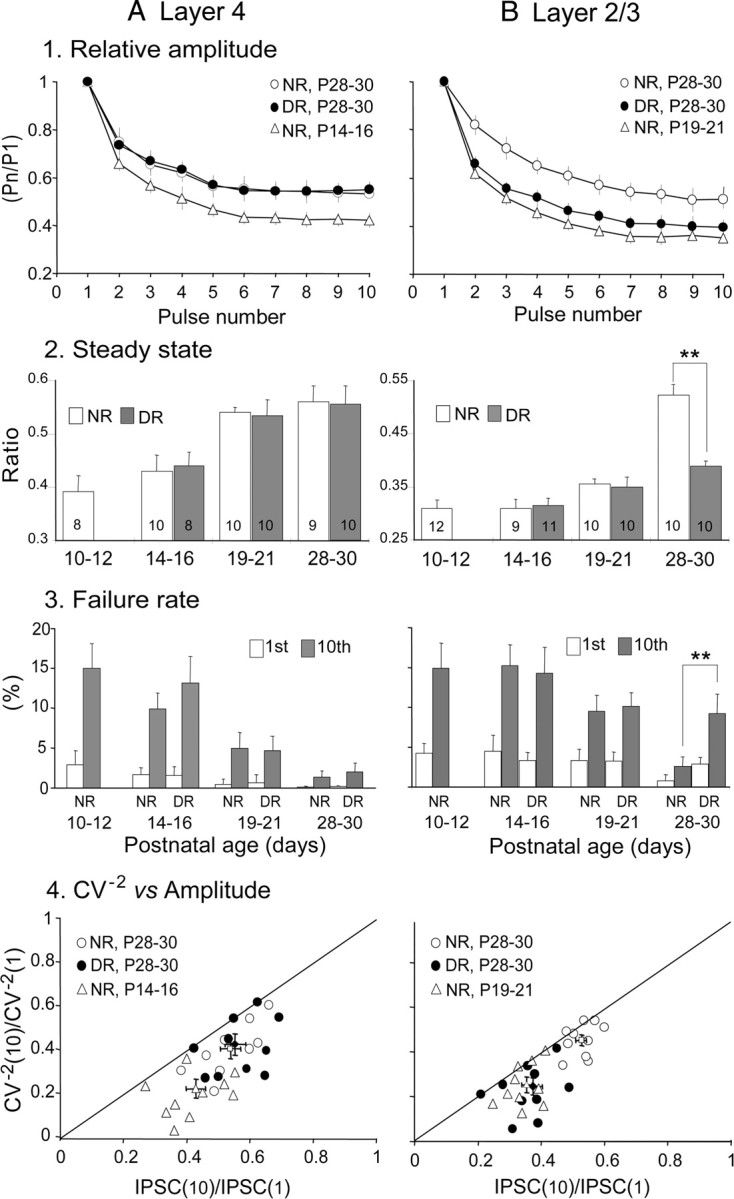
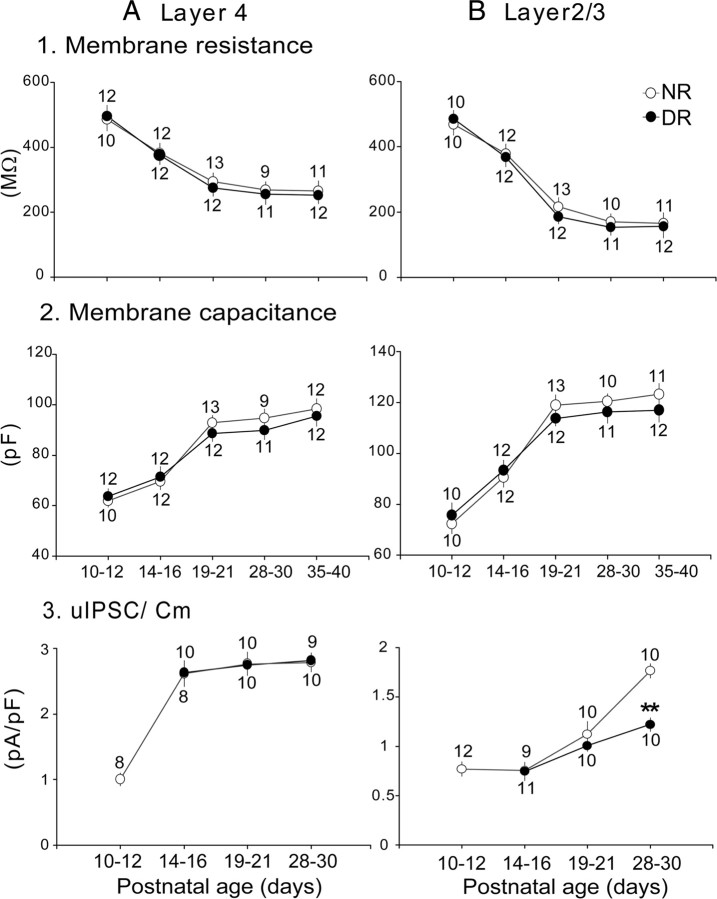
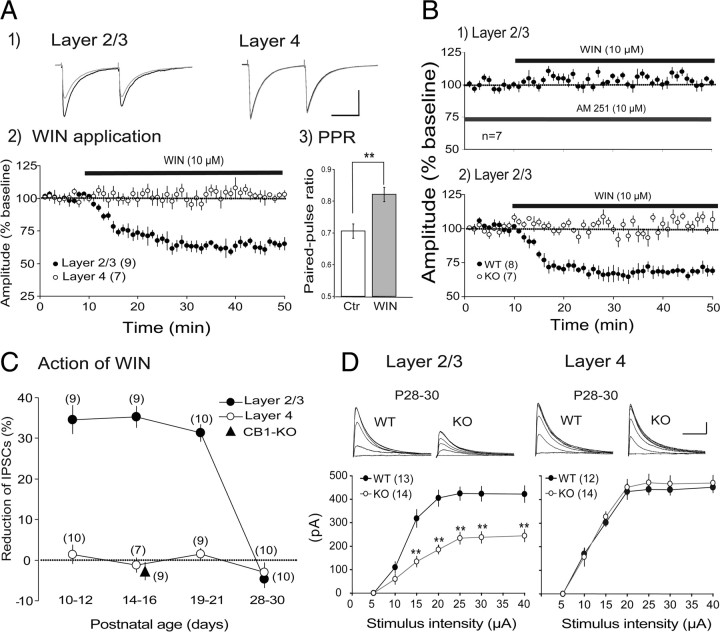
The developmental period when neuronal responses are modified by visual experience is reported to start and end earlier in layer 4 than in layer 2/3 of the visual cortex, and the maturation of GABAergic inhibitory circuits is suggested to determine the timing of this period. Here, we examine whether the laminar difference in such timing corresponds to a difference in the time course of the functional maturation of GABAergic synaptic transmission to star pyramidal and pyramidal cells in layers 4 and 2/3, respectively, of the mouse visual cortex and whether the development of the strength of GABAergic transmission is affected by visual deprivation in a laminar-specific manner. Our analysis of developmental changes in inhibitory postsynaptic currents of star pyramidal and pyramidal cells evoked by electrical stimulation of afferents or action potentials of fast-spiking GABAergic neurons revealed that there was a sequential maturation of GABAergic function from layers 4 to 2/3. The maturation of inhibition in layer 4 occurred at postnatal week 3, which preceded by 1 week that of layer 2/3. Visual deprivation by dark rearing arrested the functional development of GABAergic transmission in layer 2/3, whereas dark rearing was not so effective in layer 4. GABAergic synapses in layer 2/3 were sensitive to an agonist for cannabinoid type 1 receptors and not normally matured in receptor knock-out mice, whereas those in layer 4 were not so. These results suggest laminar-specific maturation of inhibition and susceptibility to visual deprivation, which may be related to the laminar difference in sensitivity to endocannabinoids.


Figures

Figure 1.
Figure 1.
Representative traces of eIPSC and eEPSC at different postnatal days and in the different rearing conditions. A, B, Examples of responses evoked by stimulation at a series of increasing intensity in a star pyramid cell in layer 4 (A) and a pyramidal cell in layer 2/3 (B) of the mouse visual cortex at the indicated postnatal days. Traces in the left and right columns in A and B show those obtained from normally reared and dark-reared mice, respectively. A1, B1, Images of a star pyramidal cell in layer 4 and a pyramidal cell in layer 2/3, stained with biocytin. Insets in A1 and B1 show magnified images of the boxed area in which dendritic spines are visible. Scale bars: A1, B1, 50 μm; insets, 5 μm..
Figure 2.
Figure 2.
Effects of age and visual deprivation on functional development of GABAergic transmission. A, B, Data obtained from layers 4 (A) and 2/3 (B). A1, B1, Input–output relationship of the amplitude of eIPSCs recorded in layer 4 (A1) and layer 2/3 (B1). Open triangles and circles indicate data from NR mice of the indicated age group. Filled circles indicate data from dark-reared animals. Each point is the mean value obtained from the number of cells indicated (above the points for NR and below the points for DR). A2, B2, Developmental changes in the I/E ratio in layer 4 (A2) and layer 2/3 (B2). Open and filled circles indicate data from normally reared and dark-reared mice, respectively. A3, B3, Developmental changes in the maximal amplitude of the pharmacologically isolated IPSCs recorded in the presence of APV and CNQX in layer 4 (A3) and layer 2/3 (B3). Other conventions are the same as in 2. In B2 and B3, filled and open triangles indicate data from dark-reared and light-exposed mice, respectively. **p < 0.01.
Figure 3.
Figure 3.
A, B, Images of a pair of neurons that were obtained from dual-cell patch-clamp recordings in layer 4 (A) and layer 2/3 (B) of the mouse visual cortex. Cells 1 and 2 in A are a synaptically connected pair of a FS-GABA neuron and a star pyramidal neuron, respectively, in layer 4. Cells 1 and 2 in B are a synaptically connected pair of a FS-GABA neuron and a pyramidal neuron, respectively, in layer 2/3. Scale bars: 50 μm.
Figure 4.
Figure 4.
Representative traces of uIPSCs at different ages and in the different rearing conditions. A1, B1, Examples of uIPSCs evoked in a star pyramidal neuron in layer 4 (A1) and in a pyramidal neuron in layer 2/3 (B1) by single action potentials of presynaptic FS-GABA neurons. A2, B2, Changes in the kinetics of uIPSCs in layer 4 and layer 2/3, respectively, at the indicated ages and in the indicated condition.
Figure 5.
Figure 5.
Effects of age and visual deprivation on strength and dynamics of uIPSCs of principal cells evoked by action potentials of FS-GABA neurons. A1, B1, Latency of uIPSCs of each of the star pyramidal cells in layer 4 (A1) and pyramidal cells in layer 2/3 (B1) in the age group indicated at the bottom of each column. Open and filled circles indicate values of each cell recorded from normally reared and dark-reared mice, respectively. Short horizontal and thin vertical bars indicate the mean and SEM of each age group. *p < 0.05; **p < 0.01. A2, B2, Rise time of uIPSCs of each cell in layer 4 (A2) and layer 2/3 (B2). A3, B3, Decay time of uIPSCs of each cell in layer 4 (A3) and layer 2/3 (B3). A4, B4, Peak amplitude of uIPSC of each cell in layer 4 (A4) and layer 2/3 (B4). The age groups shown at the bottom of A4 and B4 apply to all graphs.
Figure 6.
Figure 6.
A, B, Examples of frequency-dependent depression of uIPSCs recorded from a star pyramidal cell in layer 4 (A) and from a pyramidal cell in layer 2/3 (B) in response to sustained presynaptic firings at 30 Hz induced in paired FS-GABA neurons in the same layer. Ages or rearing conditions of the mice from which the records were obtained are shown in different colors, as indicated. The peak amplitudes of the uIPSCs recorded under different age and rearing conditions were scaled to the first responses for comparison.
Figure 7.
Figure 7.
A, B, Effects of age and visual deprivation on the parameters reflecting changes in presynaptic components of GABAergic transmission. A1, B1, Changes in the frequency-dependent depression of uIPSC amplitude in layer 4 (A1) and layer 2/3 (B1). A2, B2, Changes in steady-state index in layer 4 (A2) and layer 2/3 (B2). The numbers in each column indicate the number of pairs of dual whole-cell recordings. A3, B3, Changes in failure rate in layer 4 (A3) and layer 2/3 (B3). A4, B4, Relationship between changes in CV of the IPSC amplitudes and changes in mean amplitude in layer 4 (A4) and layer 2/3 (B4). Short vertical and horizontal bars indicate the mean ± SEM for the normalized value of CV−2 and for the normalized mean value for each group indicated, respectively. **p < 0.01.
Figure 8.
Figure 8.
A, B, Visual deprivation does not affect the passive properties of star pyramidal cells in layer 4 and pyramidal cells in layer 2/3. A1, B1, Changes in membrane resistance in layer 4 (A1) and layer 2/3 (B1). A2, B2, Changes in membrane capacitance in layer 4 (A2) and layer 2/3 (B2). A3, B3, Changes in the peak amplitude of uIPSCs divided by membrane capacitance in layer 4 (A3) and layer 2/3 (B3). Other conventions are the same as those in Figure 2. **p < 0.01.
Figure 9.
Figure 9.
Laminar difference in involvement of CB1Rs in GABAergic synaptic transmission. A1, Examples of eIPSCs of a layer 2/3 neuron (left) and a layer 4 neuron (right). Responses to paired-pulse stimulation before the application of WIN are superimposed with those during the application. Averages of 10 sweeps for each. Calibration: 50 ms, 100 pA. A2, Time courses of change or no change in eISPC amplitudes after starting the WIN application. The amplitude was normalized to that of control responses 5 min before the WIN application. In this and other panels, the numbers in parentheses indicate the number of cells analyzed. A3, Effects of WIN on paired-pulse ratio (PPR) of responses of nine layer 2/3 neurons. PPR were calculated as the ratio of the peak amplitude of the second responses to that of the first responses. B1, The amplitudes of eEPSCs of layer 2/3 neurons at P14–P16 are plotted against time. AM251 and WIN were applied, as indicated. B2, The amplitudes of eEPSCs of layer 2/3 neurons of CB1-KO mice (open circles) and wild-type mice (filled circles) at P14–P16. C, The depressive or no effects of WIN on eIPSCs in layer 2/3 and layer 4 of wild-type mice at indicated age. A triangle at P14–P16 indicates the value of CB1-KO mice. The ordinate indicates the ratio of the mean amplitude of eIPSCs during the WIN application to that before the application. D, Input–output relationship of the peak amplitude of eIPSCs recorded in layer 2/3 (left) and layer 4 (right). At top, traces are superimposed as shown in Figure 1. Calibration: 50 ms, 100 pA. In the lower graphs, the mean peak amplitudes of eIPSCs recorded from CB1-KO mice (open circles) and wild-type mice (filled circles) are plotted against the intensity of stimulation. Asterisks indicate that the difference in the value between CB1-KO and wild-type mice is significant at p < 0.01.

Similar articles

Cited by

References

    1. Benevento LA, Bakkum BW, Cohen RS. Gamma-aminobutyric acid and somatostatin immunoreactivity in the visual cortex of normal and dark-reared rats. Brain Res. 1995;689:172–182. - PubMed
    1. Brenowitz S, Trussell LO. Minimizing synaptic depression by control of release probability. J Neurosci. 2001;21:1857–1867. - PMC - PubMed
    1. Chattopadhyaya B, Di CG, Higashiyama H, Knott GW, Kuhlman SJ, Welker E, Huang ZJ. Experience and activity-dependent maturation of perisomatic GABAergic innervation in primary visual cortex during a postnatal critical period. J Neurosci. 2004;24:9598–9611. - PMC - PubMed
    1. Crozier RA, Wang Y, Liu CH, Bear MF. Deprivation-induced synaptic depression by distinct mechanisms in different layers of mouse visual cortex. Proc Natl Acad Sci U S A. 2007;104:1383–1388. - PMC - PubMed
    1. Cynader M. Prolonged sensitivity to monocular deprivation in dark-reared cats: effects of age and visual exposure. Brain Res. 1983;284:155–164. - PubMed

Publication types

MeSH terms

LinkOut - more resources