. 2010 Oct 20;30(42):14273-83.
doi: 10.1523/JNEUROSCI.1894-10.2010.

Influence of phasic and tonic dopamine release on receptor activation

Affiliations

Influence of phasic and tonic dopamine release on receptor activation

Jakob K Dreyer et al. J Neurosci. .

Abstract

Tonic and phasic dopamine release is implicated in learning, motivation, and motor functions. However, the relationship between spike patterns in dopaminergic neurons, the extracellular concentration of dopamine, and activation of dopamine receptors remains unresolved. In the present study, we develop a computational model of dopamine signaling that give insight into the relationship between the dynamics of release and occupancy of D(1) and D(2) receptors. The model is derived from first principles using experimental data. It has no free parameters and offers unbiased estimation of the boundaries of dopaminergic volume transmission. Bursts primarily increase occupancy of D(1) receptors, whereas pauses translate into low occupancy of D(1) and D(2) receptors. Phasic firing patterns, composed of bursts and pauses, reduce the average D(2) receptor occupancy and increase average D(1) receptor occupancy compared with equivalent tonic firing. Receptor occupancy is crucially dependent on synchrony and the balance between tonic and phasic firing modes. Our results provide quantitative insight in the dynamics of volume transmission and complement experimental data obtained with electrophysiology, positron emission tomography, microdialysis, amperometry, and voltammetry.


Figures

Figure 1.
Figure 1.
Concept of DA neurons with overlapping axonal arbors. Left, The 100 DA neurons projecting to the same region. The simulations are conducted in a small overlapping region of the arbors. Notice that soma, axons, and arbors are not drawn to scale. Right, Dopamine concentration from a simulation t = 2 ms after synchronous release from 14 terminals. The color bar indicates the concentration. Filled regions indicate where C(r,t) exceeds the limit of 50% D2 receptor occupancy. Red regions indicate where C(r,t) exceeds the limit of 50% D1 receptor occupancy. Areas outside the blue surface also contain dopamine but in concentrations lower than 10 nm.
Figure 2.
Figure 2.
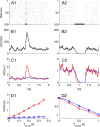
A1–D2, Effect of bursts and pauses on dopamine levels and receptors. Left column (A1–D1) shows results for bursts, and right column (A2–D2) shows pauses. A1, A2, Rastogram of spike activity across the population of neurons. Solid black lines near the x-axes indicate the duration of transients. The burst in A1 has two spikes on average, and the pause in A2 lasts 0.5 s. B1, B2, Concurrent volume-averaged levels of dopamine resultant of the spikes shown in A. C1, C2, Relative impact of transients on volume-averaged occupancy of receptors. Red, D1 receptor occupancy. Blue, D2 receptor occupancy. The occupancies are normalized so that occupancy of the tonic activity is 1. a.u., Arbitrary units. D1, D2, Integrated change in occupancy by transients of different length. Same colors as in C1 and C2.
Figure 3.
Figure 3.
Dopamine levels by spontaneous activity of mixed synchronized bursts and pauses (N ph = 50) and tonic activity (N to = 50). All neurons have 4 Hz average firing rate. A, Rastogram of the firing patterns. Neurons 1–50 indicate firing of the synchronized group, whereas neurons 51–100 are not synchronized. B, Average dopamine concentration in the simulation cube. C, Relative change in D1 and D2 receptor occupancy normalized to corresponding tonic activity (Fig. 2). Colors as in Figure 2. Black dashed line indicates the average occupancy by tonic activity.
Figure 4.
Figure 4.
The effects of phasic population size (N ph) and total population size (N = N ph + N to). Curves represent different population sizes: blue, 100; green, 70; red, 50; cyan, 30; and purple, 20. Level of dopamine and occupancy of receptors were averaged over space and time for four complete cycles (5 s). Solid lines indicate the results of synchronized burst firing, whereas dashed lines show the result of synchronized tonic firing. The x-axis indicates N ph. When N ph = 0, all neurons were assigned tonic firing. In each line, the maximal value of N ph corresponds to the population size. Left column is normalized to population size. A, Average amount of dopamine as a function of number of synchronized neurons. B, Mean occupancy of D1 receptors. C, Mean occupancy of D2 receptors.
Figure 5.
Figure 5.
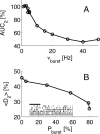
Comparison with standard burst analysis method. A, Total D2 receptor activation (AUC2) as a function of intraburst frequency. Regular spikes assigned to phasic population (N ph = 50) and no basal activity (N to = 0). B, Increasing irregularity of spike trains gives gradual increase in average D2 receptors occupancy. Inset, The 20 s extracts from the spike trains. Scale bar, 5 s.
Figure 6.
Figure 6.
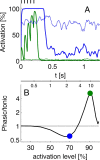
Quantification of postsynaptic activation assuming different thresholds. The results are for mixed spike pattern using same configuration as in Figure 3 (N to = 50, N ph = 50). A, Solid lines, Activity during different parts of the burst–pause cycle. Blue, D2 receptor EC70 (alternatively, D1 receptor EC02); green, D2 receptor EC90 (alternatively D1 receptor EC10). The five regular spikes of the burst are indicated above the plot. Dashed lines, Activity during corresponding tonic activity (N to = 100, N ph = 0). B, Ratio of activation with phasic firing (N to = 50, N ph = 50) compared with tonic firing (N to = 100, N ph = 0). Dashed gray line indicates when the ratio is 1 (indicating no change). Colored dots indicate the data points corresponding to the curves in A. Note logarithmic scale on the y-axis in B.
Figure 7.
Figure 7.
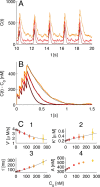
Tonic release influence time development of transients. A, Size and shape of transients depends on tonic dopamine release. Transients were evoked by a train of five stimulations at 20 Hz. Different shades of red indicate the basal dopamine level. Dark red has C 0 = 14 nm, red has C 0 = 70 nm, and orange has C 0 = 230 nm. B, Effect of background activity on average uptake kinetics. Average kinetics based on 14 transients as shown in A (same colors). Black lines show the predictions of the Michaelis–Menten model. C, Transient characteristics as function of baseline level. Quantities were found by nonlinear curve fits to the Michaelis–Menten equation; error bars indicate 95% confidence intervals (n = 5). C1, Apparent uptake velocity, V′. C2, Apparent Michaelis–Menten constant, K′. C3, Apparent time constant, τ′. C4, Amplitude of transients. Black dashed lines show the prediction of Equation 9 (C1), Equation 10 (C2), and Equation 11 (C3).

References

    1. Adams RN. In vivo electrochemical measurements in the CNS. Prog Neurobiol. 1990;35:297–311. - PubMed
    1. Anstrom KK, Woodward DJ. Restraint increases dopaminergic burst firing in awake rats. Neuropsychopharmacology. 2005;30:1832–1840. - PubMed
    1. Anstrom KK, Miczek KA, Budygin EA. Increased phasic dopamine signaling in the mesolimbic pathway during social defeat in rats. Neuroscience. 2009;161:3–12. - PMC - PubMed
    1. Arbuthnott GW, Wickens J. Space, time and dopamine. Trends Neurosci. 2007;30:62–69. - PubMed
    1. Atkins PW, De Paula J. Ed 7. New York: Freeman; 2002. Physical chemistry.

Publication types

LinkOut - more resources