. 2011 Apr;5(4):674-84.
doi: 10.1038/ismej.2010.155. Epub 2010 Oct 21.

Capturing diversity of marine heterotrophic protists: one cell at a time

Affiliations

Capturing diversity of marine heterotrophic protists: one cell at a time

Jane L Heywood et al. ISME J. 2011 Apr.

Abstract

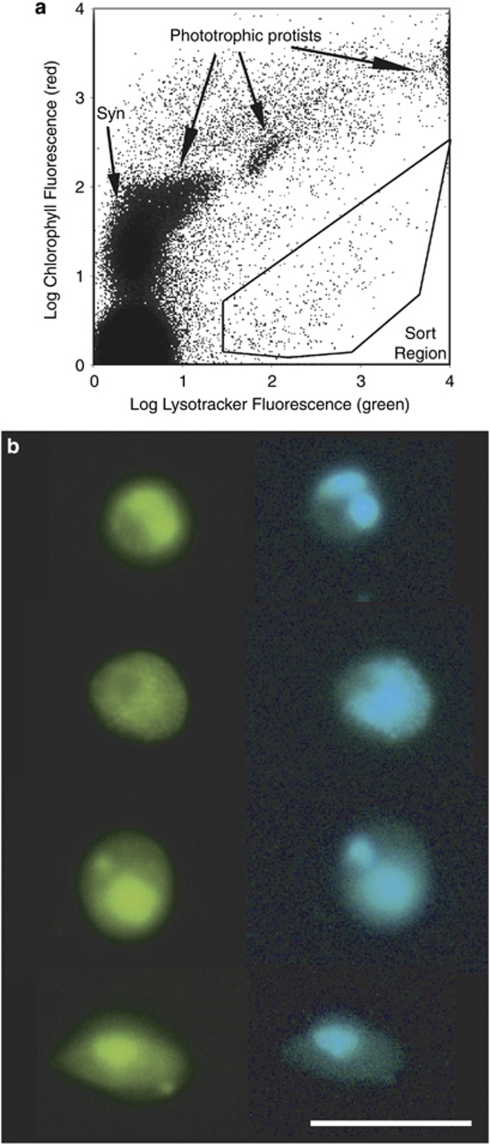
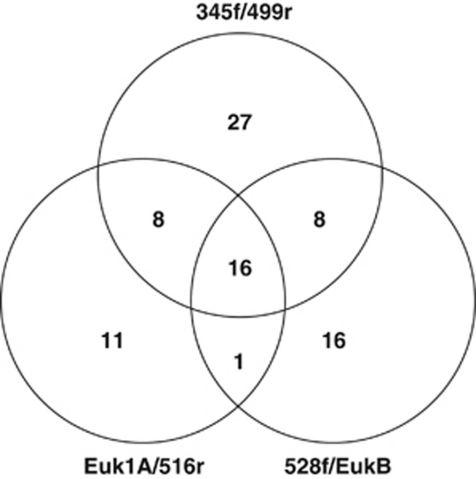
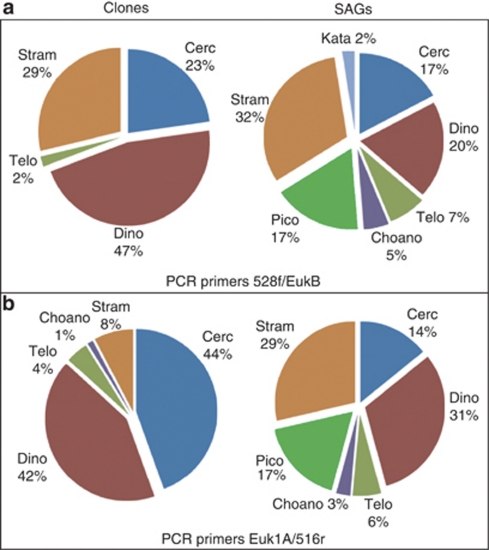
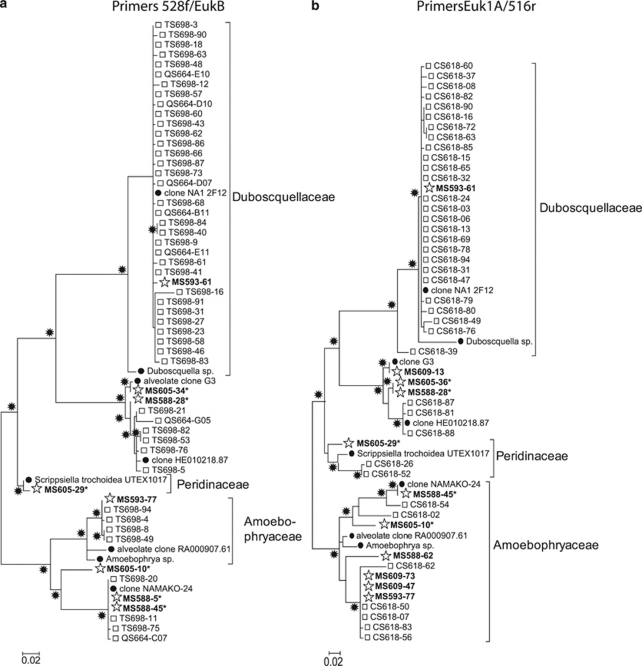
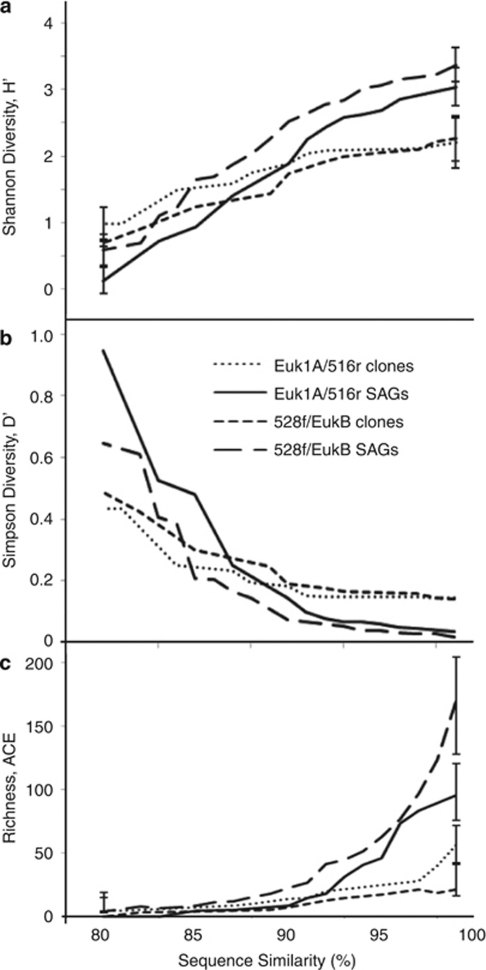
Recent applications of culture-independent, molecular methods have revealed unexpectedly high diversity in a variety of functional and phylogenetic groups of microorganisms in the ocean. However, none of the existing research tools are free from significant limitations, such as PCR and cloning biases, low phylogenetic resolution and others. Here, we employed novel, single-cell sequencing techniques to assess the composition of small (<10 μm diameter), heterotrophic protists from the Gulf of Maine. Single cells were isolated by flow cytometry, their genomes amplified, and 18S rRNA marker genes were amplified and sequenced. We compared the results to traditional environmental PCR cloning of sorted cells. The diversity of heterotrophic protists was significantly higher in the library of single amplified genomes (SAGs) than in environmental PCR clone libraries of the 18S rRNA gene, obtained from the same coastal sample. Libraries of SAGs, but not clones contained several recently discovered, uncultured groups, including picobiliphytes and novel marine stramenopiles. Clone, but not SAG, libraries contained several large clusters of identical and nearly identical sequences of Dinophyceae, Cercozoa and Stramenopiles. Similar results were obtained using two alternative primer sets, suggesting that PCR biases may not be the only explanation for the observed patterns. Instead, differences in the number of 18S rRNA gene copies among the various protist taxa probably had a significant role in determining the PCR clone composition. These results show that single-cell sequencing has the potential to more accurately assess protistan community composition than previously established methods. In addition, the creation of SAG libraries opens opportunities for the analysis of multiple genes or entire genomes of the uncultured protist groups.


Figures

Figure 1
Figure 1
(a) Flow cytometric sort region for heterotrophic protists. Target cells were inside the sort region, with high green fluorescence (Lysotracker-stained vacuoles) and low red fluorescence (chlorophyll). Phototrophic protists have high chlorophyll and Lysotracker fluorescence. Cells between the sort region and the phototrophs are likely heterotrophs with ingested chlorophyll or mixotrophs. Prokaryotes (for example, Synechococcus sp.) do not stain with Lysotracker. The large population in the lower left is noise and/or heterotrophic bacteria. Side scatter (not shown) was also used to limit the sort to smaller cells. (b) Epifluorescence photomicrographs of sorted heterotrophic protists. Cells were stained with proflavine (left, blue excitation) and DAPI (right, ultraviolet excitation) after sorting. Images of each cell were contrast-stretched. Scale bar is 10 μm.
Figure 2
Figure 2
Comparison of the yields of SAGs for the three 18S PCR primer sets used. Number of SAGs from which marine 18S rDNA gene sequences were amplified are shown.
Figure 3
Figure 3
Comparison of community composition of heterotrophic protists determined by clone libraries and SAG libraries. Results are shown from 18S rRNA gene primer pairs: (a) 528f/EukB and (b) Euk1A/516r. Phyla abbreviations are (clockwise, from 12 o'clock): Cercozoa, Dinophyceae, Telonemida, Choanoflagellida, Picobiliphyte, Stramenopile and Katablepharidaceae. In both cases SAG libraries revealed more diversity than clone libraries.
Figure 4
Figure 4
Dinophyceae phylogenetic tree of 18S rDNA sequences obtained from clones (squares), SAGs (stars and bold) and their closest relatives in GenBank (closed circles) using (a) 528f/EukB and (b) Euk1A/516r primer pairs. Stars at nodes indicate bootstrap values >70%. Asterisks (*) indicate single cells lysed by KOH, all others were lysed using Lyse-N-Go.
Figure 5
Figure 5
Shannon (a) and Simpson (b) diversity indices and abundance-based coverage estimator (ACE) richness estimator (c) for clone and SAG libraries as a function of the sequence similarity threshold to define an operational taxonomic unit (OTU). Error bars in a and c represent 95% confidence intervals (only shown at 82% and 97% similarity, for clarity).

References

    1. Altschul SF, Gish W, Miller W, Myers EW, Lipman DJ. Basic local alignment search tool. J Mol Biol. 1990;215:403–410. - PubMed
    1. Amann RI, Krumholz L, Stahl DA. Fluorescent-oligonucleotide probing of whole cells for determinative, phylogenetic, and environmental studies in microbiology. J Bacteriology. 1990;172:762–770. - PMC - PubMed
    1. Amaral-Zettler LA, McCliment EA, Ducklow HW, Huse SM. A method for studying protistan diversity using massively parallel sequencing of V9 hypervariable regions of small-subunit ribosomal RNA Genes. PLoS ONE. 2009;4:e6372. - PMC - PubMed
    1. Azam F, Fenchel T, Field JG, Meyer-Reil LA, Thingstad F. The ecological role of water-column microbes in the sea. Mar Ecol Progr Ser. 1983;10:257–263.
    1. Behnke A, Bunge J, Barger K, Breiner HW, Alla V, Stoeck T. Microeukaryote community patterns along an O2/H2S gradient in a supersulfidic fjord (Framvaren, Norway) Appl Environ Microbiol. 2006;72:3626–3636. - PMC - PubMed

Publication types

Substances