

Growth diagrams for individual finger strength in children measured with the RIHM
- PMID: 20963526
- PMCID: PMC3032876
- DOI: 10.1007/s11999-010-1638-4
Growth diagrams for individual finger strength in children measured with the RIHM
Abstract
Background: Although grip and pinch strength provide a more global measure of a large number of digits and muscles, measuring strength of individual fingers or the thumb can provide additional and more detailed information regarding hand strength.
Questions/purposes: We developed growth diagrams for individual finger strength in children.
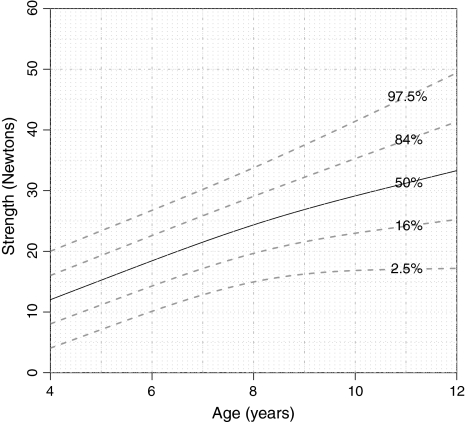
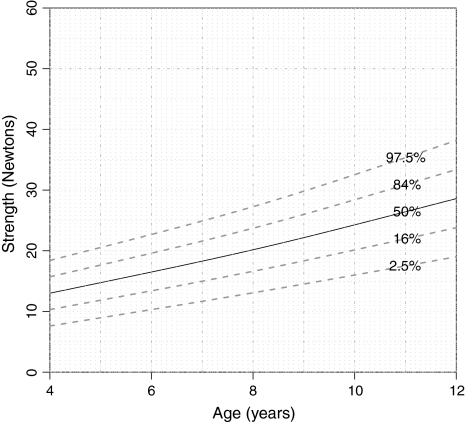
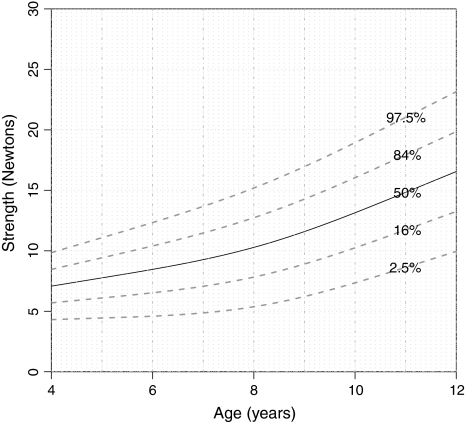
Patients and methods: We measured thumb palmar abduction, thumb opposition, and thumb flexion in the metacarpophalangeal joint, and abduction of the index and little fingers in 101 children (4-12 years old) using a myometer. We recorded hand dominance, gender, height, and weight. All measurements were performed in a randomized order by the same researcher. We developed statistical models for drawing growth diagrams using estimated percentiles for each strength measurement. Separate models for dominant and nondominant hands of boys and girls were developed, in addition to a combined model.
Results: Because there was no difference in strength between boys and girls and between dominant and nondominant hands, both hands and genders were combined in one growth diagram for each measurement. The normative data were presented in a table format and in growth diagrams for each myometer measurement.
Conclusions: These diagrams can be used for pediatric patients such as patients with congenital malformations or neuromuscular disorders who receive interventions or therapy aimed at function of the hand, fingers, or thumb. The growth diagrams facilitate distinguishing between the effects of growth and intervention on strength development.
Figures


Similar articles
-
Reliability of hand strength measurements using the Rotterdam Intrinsic Hand Myometer in children.J Hand Surg Am. 2008 Dec;33(10):1796-801. doi: 10.1016/j.jhsa.2008.07.018. J Hand Surg Am. 2008. PMID: 19084181
-
The added value of measuring thumb and finger strength when comparing strength measurements in hypoplastic thumb patients.Clin Biomech (Bristol). 2013 Oct;28(8):879-85. doi: 10.1016/j.clinbiomech.2013.07.011. Epub 2013 Jul 27. Clin Biomech (Bristol). 2013. PMID: 23948239 Clinical Trial.
-
Strength measurements of the intrinsic hand muscles: a review of the development and evaluation of the Rotterdam intrinsic hand myometer.J Hand Ther. 2006 Oct-Dec;19(4):393-401; quiz 402. doi: 10.1197/j.jht.2006.07.024. J Hand Ther. 2006. PMID: 17056399 Review.
-
Measuring intrinsic hand strength in healthy adults: The accuracy intrarater and inter-rater reliability of the Rotterdam Intrinsic Hand Myometer.J Hand Ther. 2018 Oct-Dec;31(4):530-537. doi: 10.1016/j.jht.2017.03.002. Epub 2017 Apr 28. J Hand Ther. 2018. PMID: 28457691
-
Growth diagrams for grip strength in children.Clin Orthop Relat Res. 2010 Jan;468(1):217-23. doi: 10.1007/s11999-009-0881-z. Epub 2009 May 21. Clin Orthop Relat Res. 2010. PMID: 19459024 Free PMC article.
Cited by
-
Reference values for muscle strength: a systematic review with a descriptive meta-analysis.Braz J Phys Ther. 2018 Sep-Oct;22(5):355-369. doi: 10.1016/j.bjpt.2018.02.006. Epub 2018 May 3. Braz J Phys Ther. 2018. PMID: 29764761 Free PMC article.
-
Generalized joint hypermobility in healthy female koreans: prevalence and age-related differences.Ann Rehabil Med. 2013 Dec;37(6):832-8. doi: 10.5535/arm.2013.37.6.832. Epub 2013 Dec 23. Ann Rehabil Med. 2013. PMID: 24466518 Free PMC article.
-
Reference values of intrinsic muscle strength of the hand of adolescents and young adults.J Hand Ther. 2018 Jul-Sep;31(3):348-356. doi: 10.1016/j.jht.2017.05.012. Epub 2017 Aug 12. J Hand Ther. 2018. PMID: 28807597 Free PMC article.
References
-
- American Society of Hand Therapists. Clinical Assessment Recommendations, 2nd ed. Garner, NC: American Society of Hand Therapists; 1992.
Publication types
MeSH terms
LinkOut - more resources
Full Text Sources
