. 2010 Dec;12(4):729-40.
doi: 10.1208/s12248-010-9234-9. Epub 2010 Oct 21.

Pharmacodynamics-mediated drug disposition (PDMDD) and precursor pool lifespan model for single dose of romiplostim in healthy subjects

Affiliations

Pharmacodynamics-mediated drug disposition (PDMDD) and precursor pool lifespan model for single dose of romiplostim in healthy subjects

Yow-Ming C Wang et al. AAPS J. 2010 Dec.

Abstract

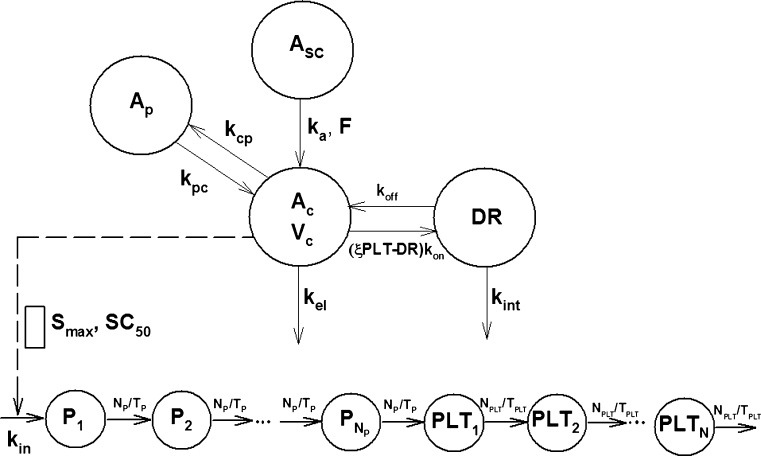
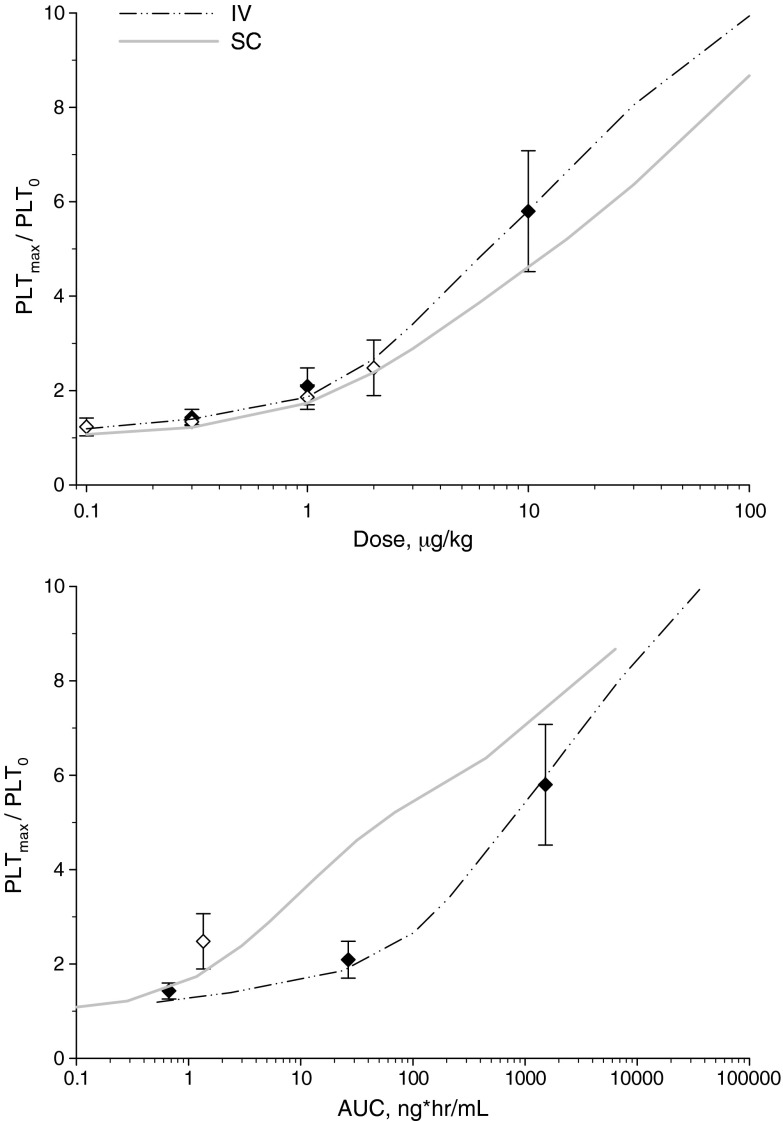
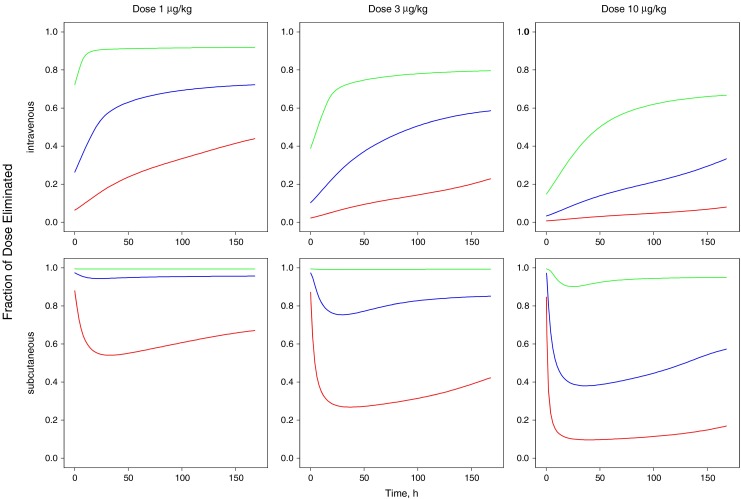
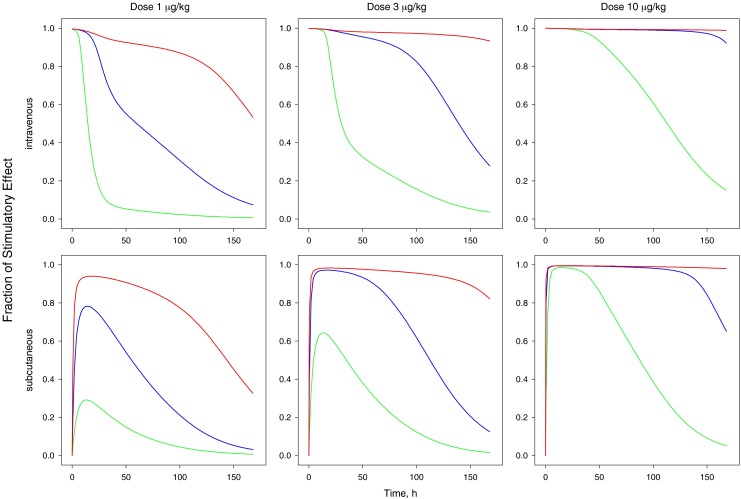
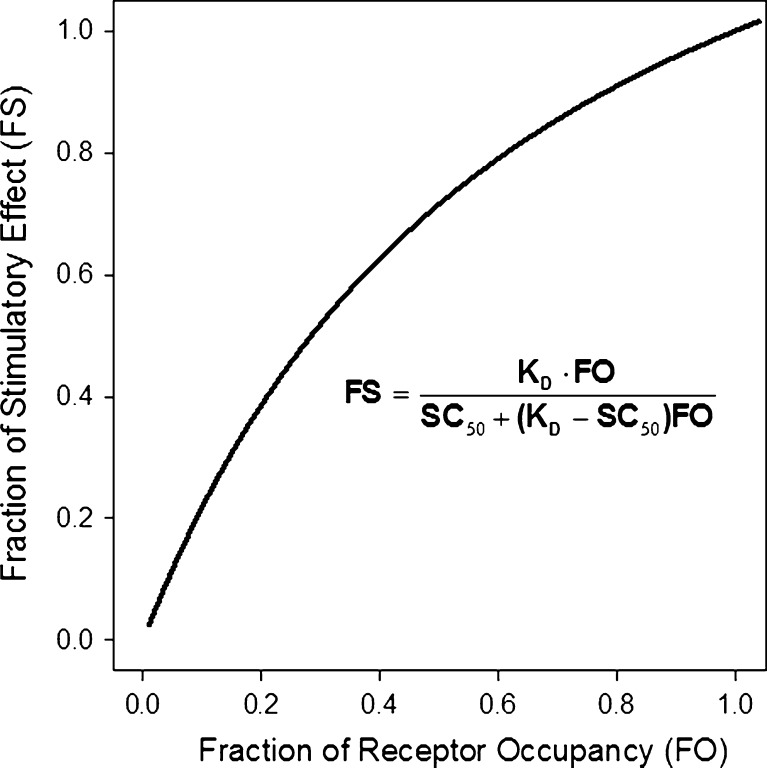
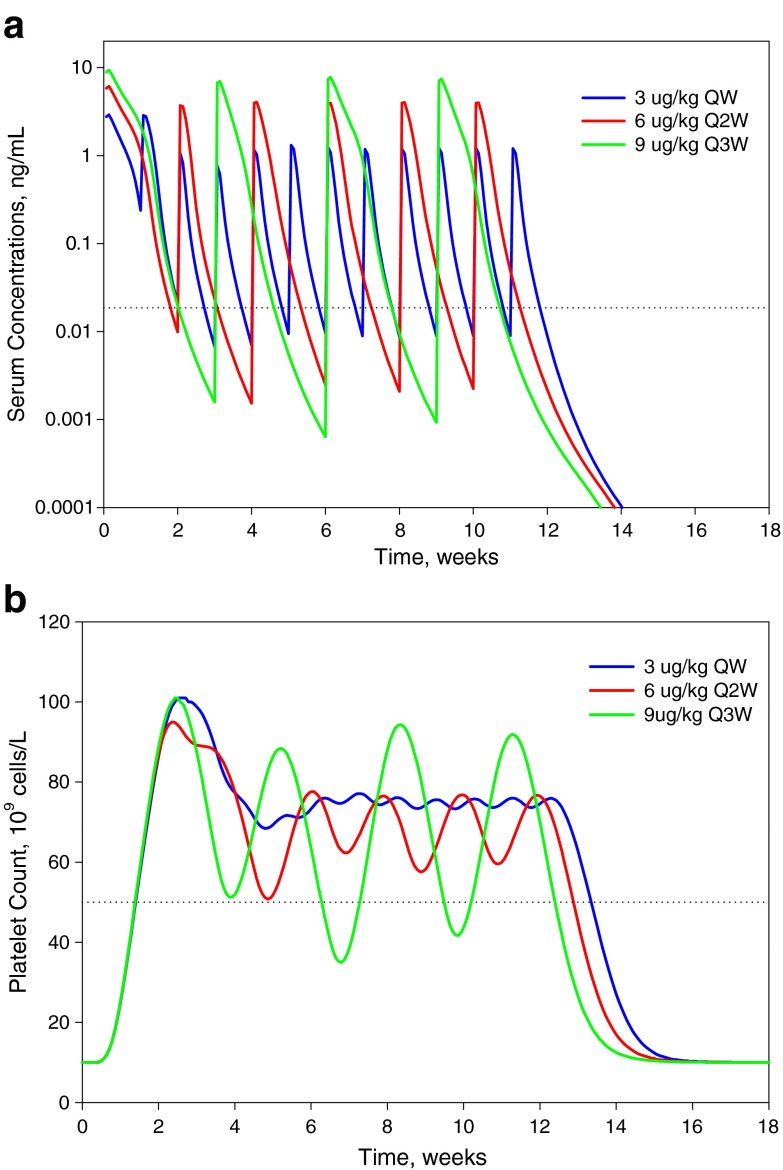
The objective of this study was to characterize the pharmacokinetics and pharmacodynamics (PK-PD) of romiplostim after single-dose administration in healthy subjects. The mean serum romiplostim concentrations (PK data) and mean platelet counts (PD data) collected from 32 subjects receiving a single intravenous (0.3, 1 and 10 μg/kg) or subcutaneous (0.1, 0.3, 1, and 2 μg/kg) dose were fitted simultaneously to a mechanistic PK-PD model based on pharmacodynamics-mediated drug disposition (PDMDD) and a precursor pool lifespan concept. The two-compartment PK model incorporated receptor-mediated endocytosis and linear mechanisms as parallel elimination pathways. The maximal concentration of receptors (assumed to be proportional to the platelet count), the equilibrium dissociation constant, and the first-order internalization rate constant for endocytosis of the drug-receptor complex were 0.022 fg/platelet, 0.131 ng/mL, and 0.173 h⁻¹, respectively. Romiplostim concentration stimulates the production of platelet precursors via the Hill function, where the SC₅₀ was 0.052 ng/mL and S (max) was 11.2. The estimated precursor cell and platelet lifespans were 5.9 and 10.5 days, respectively. Model-based simulations revealed that the romiplostim exposure and the platelet response are both dependent on the dose administered and the baseline platelet counts. Also, weekly dosing produced a sustained PD response while dosing intervals ≥2 weeks resulted in fluctuating platelet counts. Thus, the mechanistic PK-PD model was suitable for describing the romiplostim PK-PD interplay (PDMDD), the dose-dependent platelet stimulation, and the lifespans of thrombopoietic cell populations.


Figures

Fig. 1
Fig. 1
A PDMDD and lifespan PK/PD model for romiplostim. A 1, A 2, A 3 are the depot, central, and peripheral compartments, respectively. The inter-compartmental transfer rate constants from central to peripheral compartment and from peripheral to central compartment are k cp and k pc, respectively. Drug from the central compartment can be eliminated by a first-order process with a rate constant k el, or can bind to c-Mpl receptors at a rate characterized by k on to form a drug-receptor complex (DR), i.e., the DR compartment. This complex may either dissociate (k off) or be internalized and degraded (k int). ξPLT-DR stands for the amount of receptors not bound to drug. ξ is the TPO receptor density/platelet. T P and T PLT stand for the lifespan of precursor cells and platelets. N P and N PLT stand for the number of age-compartments for the precursor cells and platelets; N P = N PLT = 10. P 1, P 2, … P Np are the age-compartments for various stages of the precursor cells. PLT1, PLT2, … PLTN are the age-compartments for various stages of the platelets. The sum of platelet counts in all PLTN compartments is PLT. k in is the rate of production of the precursor cells. S max represents the maximum extent of stimulation and SC50 is the concentration required for 50% maximum stimulation. The subcutaneous absorption rate constant is k a, and F is the absolute bioavailability
Fig. 2
Fig. 2
Goodness-of-fit plots by the route of administration: pharmacokinetic data (upper panel), pharmacodynamic data (lower panel). The symbols represent the observed data with standard deviation represented in the error bars and the lines represent the model predictions. The lower limit of quantification for romiplostim ELISA assay was included as the dashed line in the pharmacokinetic profiles
Fig. 3
Fig. 3
Dose–response curves (upper panel) and AUC—response curves (lower panel). The symbols represent the observed values with standard deviation represented in the error bars, and lines represented simulated exposure–response curves using parameters presented in Table I
Fig. 4
Fig. 4
Effect of platelet counts at baseline on romiplostim serum concentrations and platelet counts following administration of a single IV (left panels) or SC (right panels) dose of 10 μg/kg romiplostim
Fig. 5
Fig. 5
Effect of dose and platelet counts at baseline on the fraction of dose eliminated via target-mediated clearance pathways vs. time following IV and SC dosing of romiplostim. Baseline platelet counts are 10 × 109 cells/L (red line), 50 × 109 cells/L (blue line), and 250 × 109 cells/L (green line)
Fig. 6
Fig. 6
Effect of dose and platelet counts at baseline on the time course of the typical fractional receptor occupancy following IV and SC dosing of romiplostim. Baseline platelet counts are 10 × 109 cells/L (red line), 50 × 109 cells/L (blue line), and 250 × 109 cells/L (green line)
Fig. 7
Fig. 7
Effect of dose and platelet counts at baseline on the time course of the typical fractional stimulatory effect following IV and SC dosing of romiplostim. Baseline platelet counts are ten (red line), 50 (blue line), and 250 (green line) × 109 cells/L
Fig. 8
Fig. 8
A curve representing the relationship between the fraction of stimulatory effect (FS) and the fraction of the receptor occupancy (FO). This relationship is independent of the dose and route of administration
Fig. 9
Fig. 9
Typical time course of romiplostim serum concentrations and platelet counts following repeated SC administration of 12 doses of 3 μg/kg QW, six doses of 6 μg/kg Q2W, and four doses of 9 μg/kg Q3W. The dotted lines represent the lower limit of quantification (18 pg/mL) of the bioanlaytical assay in the time course of serum concentration (top panel) and the platelet count of 50 × 109 cells/L in the time course of the platelet count (bottom panel)

References

    1. Geddis AE, Linden HM, Kaushansky K. Thrombopoietin: a pan-hematopoietic cytokine. Cytokine Growth Factor Rev. 2002;13:61–73. doi: 10.1016/S1359-6101(01)00030-2. - DOI - PubMed
    1. Cardier JE, Dempsey J. Thrombopoietin and its receptor, c-mpl, are constitutively expressed by mouse liver endothelial cells: evidence of thrombopoietin as a growth factor for liver endothelial cells. Blood. 1998;91:923–9. - PubMed
    1. Sungaran R, Markovic B, Chong BH. Localization and regulation of thrombopoietin mRNa expression in human kidney, liver, bone marrow, and spleen using in situ hybridization. Blood. 1997;89:101–7. - PubMed
    1. Kuter DJ, Rosenberg RD. The reciprocal relationship of thrombopoietin (c-Mpl ligand) to changes in the platelet mass during busulfan-induced thrombocytopenia in the rabbit. Blood. 1995;85:2720–30. - PubMed
    1. Li J, Yang C, Xia Y, Bertino A, Glaspy J, Roberts M, et al. Thrombocytopenia caused by the development of antibodies to thrombopoietin. Blood. 2001;98:3241–8. doi: 10.1182/blood.V98.12.3241. - DOI - PubMed

Publication types

LinkOut - more resources