

Computerized assessment of pulmonary fissure integrity using high resolution CT
- PMID: 20964185
- PMCID: PMC2937051
- DOI: 10.1118/1.3475937
Computerized assessment of pulmonary fissure integrity using high resolution CT
Abstract
Purpose: Knowledge of pulmonary interlobar fissure integrity is of interest in a number of clinical and investigational applications. The authors developed and tested a high resolution CT based automated computerized scheme for this purpose.
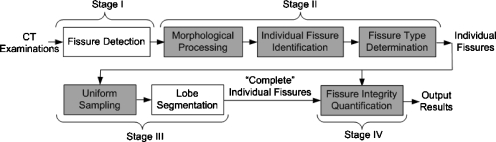
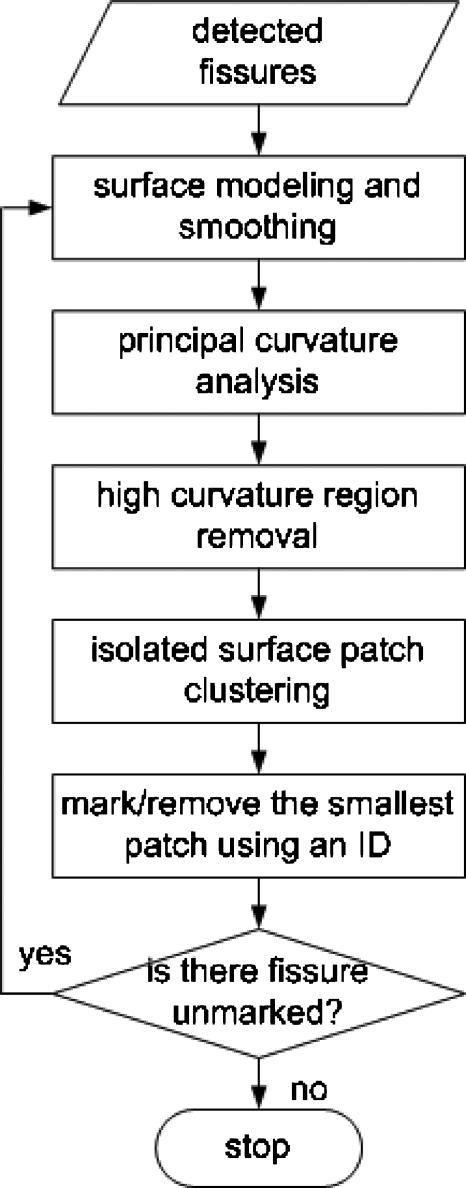
Methods: The fissure integrity assessment scheme consists of the following steps: (1) Fissure detection, (2) individual fissure identification, (3) fissure type determination, (4) "complete" interlobe surface estimation, and (5) fissure integrity estimation. For evaluation purposes, 50 anonymized chest CT examinations were ascertained and the complete and "incomplete" regions of the fissures of interest were manually marked by two experienced radiologists. After applying the scheme to the same examinations, differences among fissure percent completeness estimates based on the radiologists' manual markings and the automated computerized scheme were computed and compared.
Results: Average differences in estimated fissure percent completeness (integrity) between the results of the computerized scheme and that based on each of the two radiologists' markings were 6.88% +/- 5.86%, 9.57% +/- 7.77%, and 4.19% +/- 5.64% for the right major fissures, the right minor fissures, and the left major fissures, respectively. The differences between results based on radiologists' markings for the same fissures were 4.27% +/- 3.32%, 7.02% +/- 5.54%, and 4.23% +/- 4.93%, respectively. The difference among the three matched measurement sets for each fissure were statistically significant (Friedman's test, p < or = 0.005) but paired comparisons showed that much of the observed difference was related to inter-reader differences rather than reader-computerized scheme differences. Computerized estimates were correlated with each of the radiologist's estimates (Spearman, p < 0.0001).
Conclusions: While variability between readers-based estimates of fissure integrity was smaller than differences between the computerized scheme and each of the readers, the result reported here are quite encouraging in that the magnitude of these differences were in the same magnitude, demonstrating the feasibility of using a computerized scheme for this purpose.
Figures

Similar articles
-
Identification of pulmonary fissures using a piecewise plane fitting algorithm.Comput Med Imaging Graph. 2012 Oct;36(7):560-71. doi: 10.1016/j.compmedimag.2012.06.001. Epub 2012 Jun 29. Comput Med Imaging Graph. 2012. PMID: 22749811 Free PMC article.
-
A Computational geometry approach to automated pulmonary fissure segmentation in CT examinations.IEEE Trans Med Imaging. 2009 May;28(5):710-9. doi: 10.1109/TMI.2008.2010441. Epub 2008 Dec 9. IEEE Trans Med Imaging. 2009. PMID: 19272987 Free PMC article.
-
The accuracy of computed tomography to predict completeness of pulmonary fissures. A prospective study.Ann Am Thorac Soc. 2015 May;12(5):696-700. doi: 10.1513/AnnalsATS.201407-343OC. Ann Am Thorac Soc. 2015. PMID: 25746111
-
Prevalence of incomplete interlobar fissures of the lung.Biomed Pap Med Fac Univ Palacky Olomouc Czech Repub. 2016 Dec;160(4):491-494. doi: 10.5507/bp.2016.049. Epub 2016 Oct 26. Biomed Pap Med Fac Univ Palacky Olomouc Czech Repub. 2016. PMID: 27829688 Review.
-
Radiographic and CT appearances of the major fissures.Radiographics. 2001 Jul-Aug;21(4):861-74. doi: 10.1148/radiographics.21.4.g01jl24861. Radiographics. 2001. PMID: 11452059 Review.
Cited by
-
Identification of pulmonary fissures using a piecewise plane fitting algorithm.Comput Med Imaging Graph. 2012 Oct;36(7):560-71. doi: 10.1016/j.compmedimag.2012.06.001. Epub 2012 Jun 29. Comput Med Imaging Graph. 2012. PMID: 22749811 Free PMC article.
-
An open-source framework for pulmonary fissure completeness assessment.Comput Med Imaging Graph. 2020 Jul;83:101712. doi: 10.1016/j.compmedimag.2020.101712. Epub 2020 Feb 21. Comput Med Imaging Graph. 2020. PMID: 32115275 Free PMC article.
-
Pulmonary fissure integrity and collateral ventilation in COPD patients.PLoS One. 2014 May 6;9(5):e96631. doi: 10.1371/journal.pone.0096631. eCollection 2014. PLoS One. 2014. PMID: 24800803 Free PMC article.
-
Attention U-net for automated pulmonary fissure integrity analysis in lung computed tomography images.Sci Rep. 2023 Aug 29;13(1):14135. doi: 10.1038/s41598-023-41322-y. Sci Rep. 2023. PMID: 37644125 Free PMC article.
-
Automatic pulmonary fissure detection and lobe segmentation in CT chest images.Biomed Eng Online. 2014 May 7;13:59. doi: 10.1186/1475-925X-13-59. Biomed Eng Online. 2014. PMID: 24886031 Free PMC article.
References
-
- Hayashi K., Aziz A., Ashizawa K., Hayashi H., Nagaoki K., and Otsuji H., “Radiographic and CT appearances of the major fissures,” Radiographics ZZZZZZ 21, 861–874 (2001). - PubMed
-
- Berkmen T., Berkmen Y. M., and Austin J. H. M., “Accessory Fissures of the upper lobe of the left lung: CT and plain film appearance,” AJR, Am. J. Roentgenol. AAJRDX 162, 1287–1293 (1994). - PubMed
Publication types
MeSH terms
Grants and funding
LinkOut - more resources
Full Text Sources
Other Literature Sources
Medical
