Variation in prescription use and spending for lipid-lowering and diabetes medications in the Veterans Affairs Healthcare System
- PMID: 20964470
- PMCID: PMC3096004
Variation in prescription use and spending for lipid-lowering and diabetes medications in the Veterans Affairs Healthcare System
Abstract
Objectives: To examine variation in outpatient prescription use and spending for hyperlipidemia and diabetes mellitus in the Veterans Affairs Healthcare System (VA) and its association with quality measures for these conditions.
Study design: Cross-sectional.
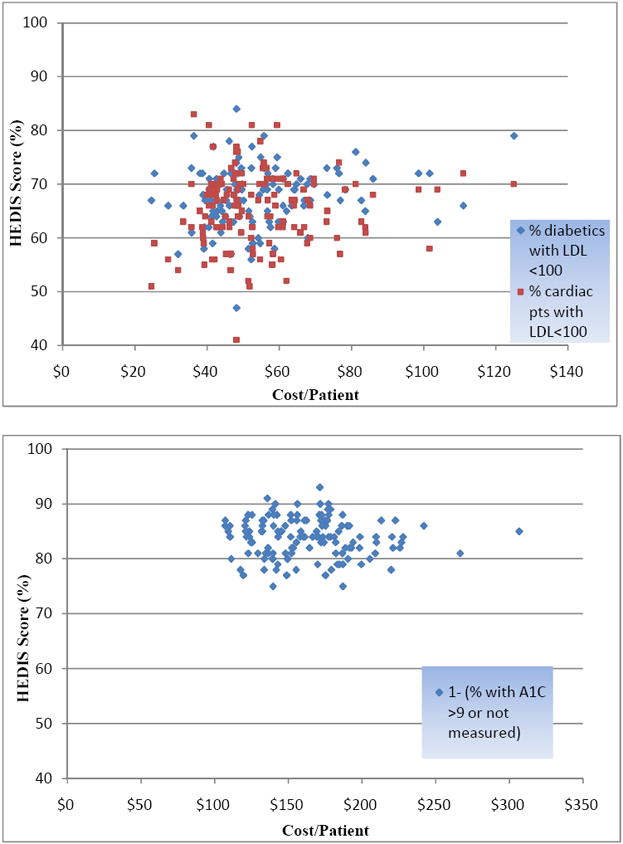
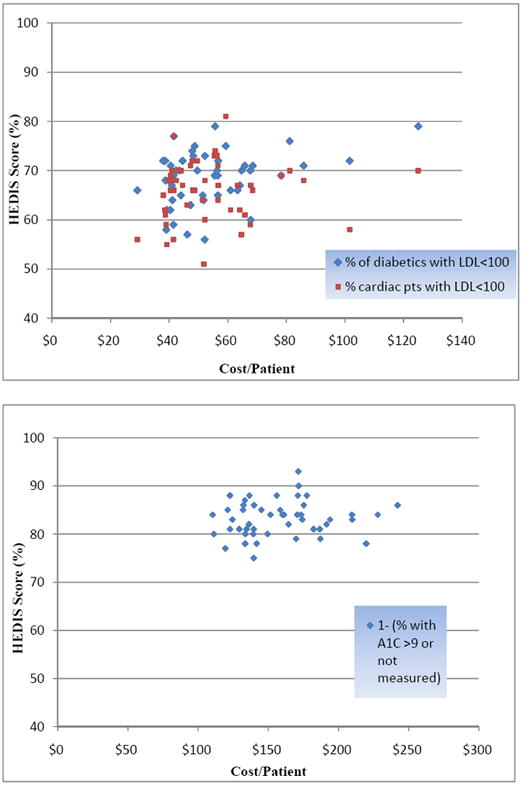
Methods: We compared outpatient prescription use, spending, and quality of care across 135 VA medical centers (VAMCs) in fiscal year 2008, including 2.3 million patients dispensed lipid-lowering medications and 981,031 patients dispensed diabetes medications. At each facility, we calculated VAMC-level cost per patient for these medications, the proportion of patients taking brand-name drugs, and Healthcare Effectiveness Data and Information Set (HEDIS) scores for hyperlipidemia (low-density lipoprotein cholesterol level <100 mg/dL) and for diabetes (glycosylated hemoglobin level >9% or not measured).
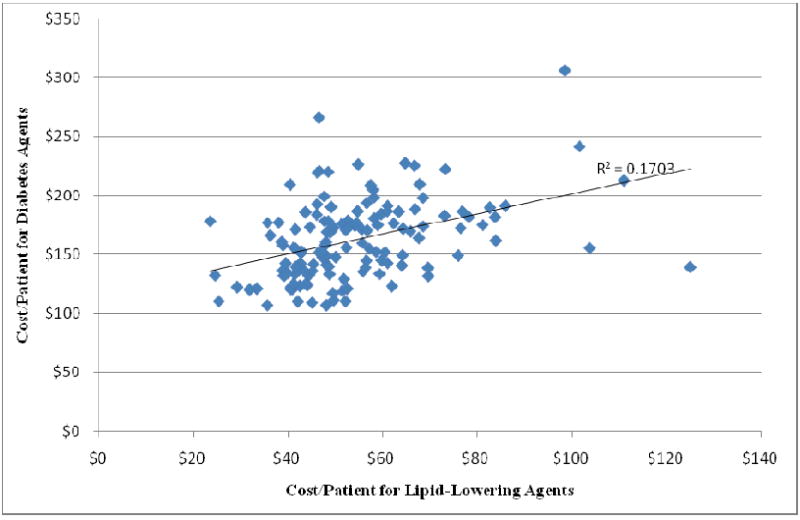
Results: The median cost per patient for lipid-lowering agents in fiscal year 2008 was $49.60 and varied from $39.68 in the least expensive quartile of VAMCs to $69.57 in the most expensive quartile (P < .001). For diabetes agents, the median cost per patient was $158.34 and varied from $123.34 in the least expensive quartile to $198.31 in the most expensive quartile (P < .001). The proportion of patients dispensed brand-name oral drugs among these classes in the most expensive quartile of VAMCs was twice that in the least expensive quartile (P < .001). There was no correlation between VAMC-level prescription spending and performance on HEDIS measures for lipid-lowering drugs (r = 0.12 and r = 0.07) or for diabetes agents (r = -0.10).
Conclusions: Despite the existence of a closely managed formulary, significant variation in prescription spending and use of brand-name drugs exists in the VA. Although we could not explicitly risk-adjust, there appears to be no relationship between prescription spending and quality of care.
Figures
References
-
- Wennberg JE, Cooper MM. The Dartmouth Atlas of Health Care in the United States. Chicago: AHA Press: Dartmouth Medical School. Center for Evaluative Clinical Sciences; 1996. - PubMed
-
- Gawande A. The cost conundrum: What a Texas town can teach us about health care. The New Yorker. 2009 June;1:36–44. - PubMed
-
- Health Care Spending, Quality, and Outcomes: More Isn’t Always Better. [March 25, 2009];The Dartmouth Institute for Health Policy and Clinical Practice. 2009 February 27; 2009, at http://www.dartmouthatlas.org/atlases/Spending_Brief_022709.pdf. - PubMed
-
- Fisher ES, Wennberg DE, Stukel TA, Gottlieb DJ, Lucas FL, Pinder EtL. The Implications of Regional Variations in Medicare Spending. Part 2: Health Outcomes and Satisfaction with Care. Ann Intern Med. 2003;138:288–98. - PubMed
Publication types
MeSH terms
Substances
Grants and funding
LinkOut - more resources
Full Text Sources
Medical