

Unified segmentation based correction of R1 brain maps for RF transmit field inhomogeneities (UNICORT)
- PMID: 20965260
- PMCID: PMC3018573
- DOI: 10.1016/j.neuroimage.2010.10.023
Unified segmentation based correction of R1 brain maps for RF transmit field inhomogeneities (UNICORT)
Abstract
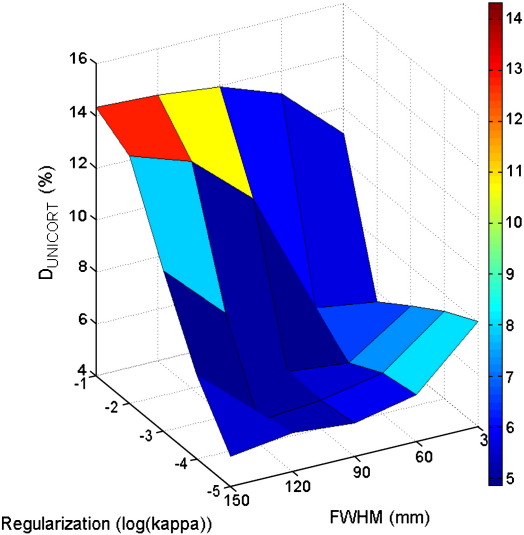
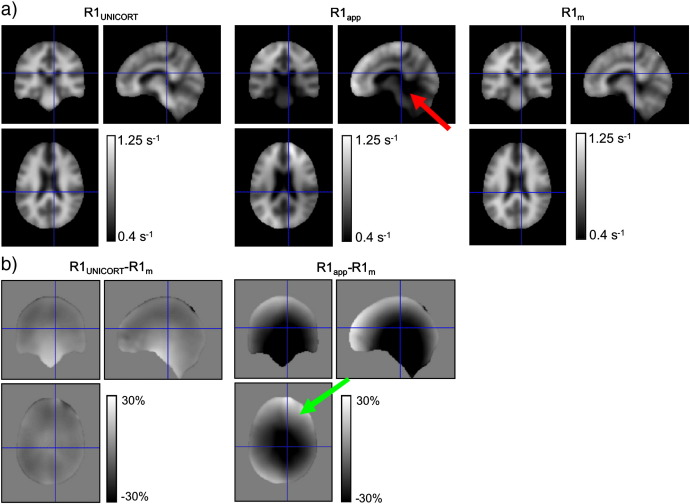
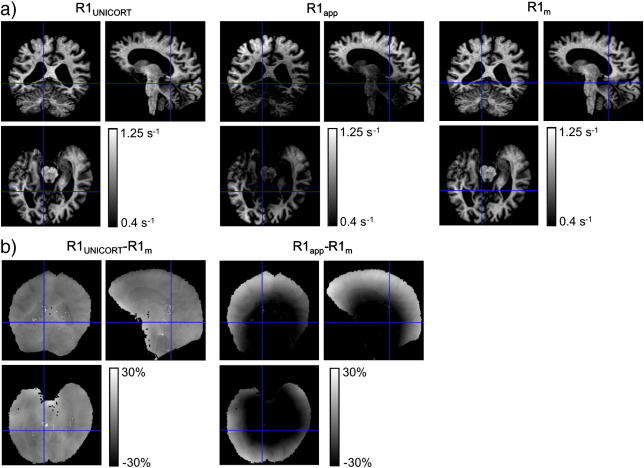
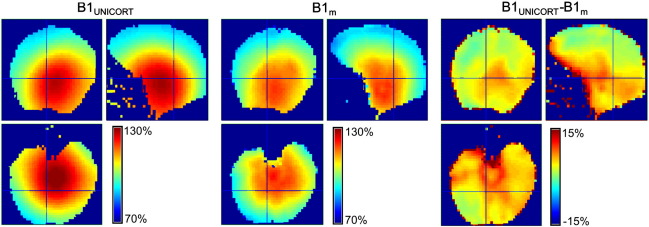
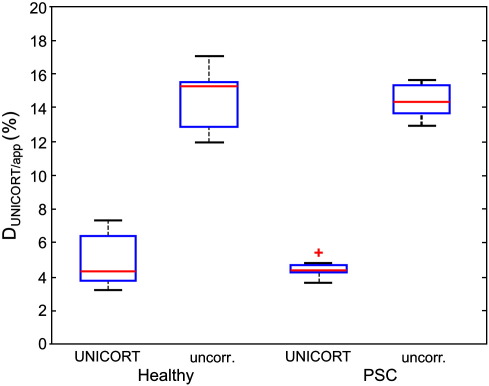
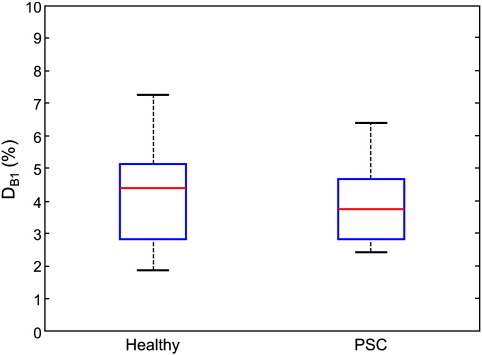
Quantitative mapping of the longitudinal relaxation rate (R1=1/T1) in the human brain enables the investigation of tissue microstructure and macroscopic morphology which are becoming increasingly important for clinical and neuroimaging applications. R1 maps are now commonly estimated from two fast high-resolution 3D FLASH acquisitions with variable excitation flip angles, because this approach is fast and does not rely on special acquisition techniques. However, these R1 maps need to be corrected for bias due to RF transmit field (B1(+)) inhomogeneities, requiring additional B1(+) mapping which is usually time consuming and difficult to implement. We propose a technique that simultaneously estimates the B1(+) inhomogeneities and R1 values from the uncorrected R1 maps in the human brain without need for B1(+) mapping. It employs a probabilistic framework for unified segmentation based correction of R1 maps for B1(+) inhomogeneities (UNICORT). The framework incorporates a physically informed generative model of smooth B1(+) inhomogeneities and their multiplicative effect on R1 estimates. Extensive cross-validation with the established standard using measured B1(+) maps shows that UNICORT yields accurate B1(+) and R1 maps with a mean deviation from the standard of less than 4.3% and 5%, respectively. The results of different groups of subjects with a wide age range and different levels of atypical brain anatomy further suggest that the method is robust and generalizes well to wider populations. UNICORT is easy to apply, as it is computationally efficient and its basic framework is implemented as part of the tissue segmentation in SPM8.
Copyright © 2010 Elsevier Inc. All rights reserved.
Figures
Similar articles
-
Four-angle method for practical ultra-high-resolution magnetic resonance mapping of brain longitudinal relaxation time and apparent proton density.Magn Reson Imaging. 2020 Feb;66:57-68. doi: 10.1016/j.mri.2019.11.013. Epub 2019 Nov 12. Magn Reson Imaging. 2020. PMID: 31730882 Free PMC article.
-
Simultaneous B1 and T1 mapping using spiral multislice variable flip angle acquisitions for whole-brain coverage in less than one minute.Magn Reson Med. 2019 Mar;81(3):1876-1889. doi: 10.1002/mrm.27544. Epub 2018 Nov 12. Magn Reson Med. 2019. PMID: 30417936
-
Perturbation analysis of the effects of B1+ errors on parallel excitation in MRI.Annu Int Conf IEEE Eng Med Biol Soc. 2009;2009:4064-6. doi: 10.1109/IEMBS.2009.5333196. Annu Int Conf IEEE Eng Med Biol Soc. 2009. PMID: 19964100
-
Data-Driven Retrospective Correction of B1 Field Inhomogeneity in Fast Macromolecular Proton Fraction and R1 Mapping.IEEE Trans Med Imaging. 2021 Dec;40(12):3473-3484. doi: 10.1109/TMI.2021.3088258. Epub 2021 Nov 30. IEEE Trans Med Imaging. 2021. PMID: 34110989 Free PMC article.
-
Using high-resolution quantitative mapping of R1 as an index of cortical myelination.Neuroimage. 2014 Jun;93 Pt 2:176-88. doi: 10.1016/j.neuroimage.2013.06.005. Epub 2013 Jun 10. Neuroimage. 2014. PMID: 23756203 Review.
Cited by
-
Change in Latent Gray-Matter Structural Integrity Is Associated With Change in Cardiovascular Fitness in Older Adults Who Engage in At-Home Aerobic Exercise.Front Hum Neurosci. 2022 May 17;16:852737. doi: 10.3389/fnhum.2022.852737. eCollection 2022. Front Hum Neurosci. 2022. PMID: 35655926 Free PMC article.
-
Changes in MEG resting-state networks are related to cognitive decline in type 1 diabetes mellitus patients.Neuroimage Clin. 2014 Jun 12;5:69-76. doi: 10.1016/j.nicl.2014.06.001. eCollection 2014. Neuroimage Clin. 2014. PMID: 25003029 Free PMC article.
-
Tracking sensory system atrophy and outcome prediction in spinal cord injury.Ann Neurol. 2015 Nov;78(5):751-61. doi: 10.1002/ana.24508. Epub 2015 Sep 18. Ann Neurol. 2015. PMID: 26290444 Free PMC article.
-
Human hippocampus arbitrates approach-avoidance conflict.Curr Biol. 2014 Mar 3;24(5):541-7. doi: 10.1016/j.cub.2014.01.046. Epub 2014 Feb 20. Curr Biol. 2014. PMID: 24560572 Free PMC article.
-
An algorithm for learning shape and appearance models without annotations.Med Image Anal. 2019 Jul;55:197-215. doi: 10.1016/j.media.2019.04.008. Epub 2019 Apr 30. Med Image Anal. 2019. PMID: 31096134 Free PMC article.
References
-
- Ashburner J. A fast diffeomorphic image registration algorithm. Neuroimage. 2007;38:95–113. - PubMed
-
- Ashburner J., Friston K. Unified segmentation. Neuroimage. 2005;26:839–851. - PubMed
-
- Ashburner J., Csernansky J., Davatzikos C., Fox N., Frisoni G., Thompson P. Computer-assisted imaging to assess brain structure in healthy and diseased brains. Lancet Neurol. 2003;2:79–88. - PubMed
-
- Dathe H., Helms G. Exact algebraization of the signal equation of spoiled gradient echo MRI. Phys. Med. Biol. 2010;55:4231–4245. - PubMed
Publication types
MeSH terms
Grants and funding
LinkOut - more resources
Full Text Sources
Other Literature Sources
