

R/qtl: high-throughput multiple QTL mapping
- PMID: 20966004
- PMCID: PMC2982156
- DOI: 10.1093/bioinformatics/btq565
R/qtl: high-throughput multiple QTL mapping
Abstract
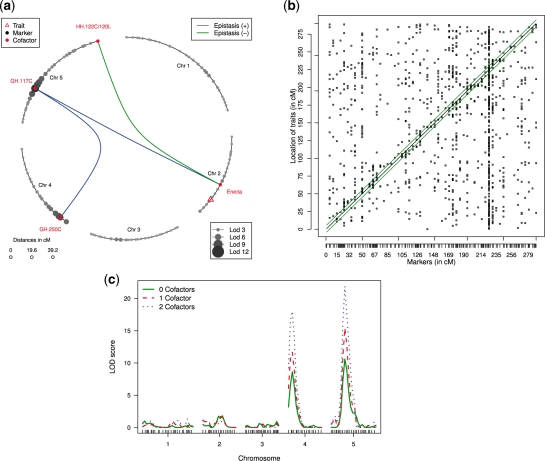
Motivation: R/qtl is free and powerful software for mapping and exploring quantitative trait loci (QTL). R/qtl provides a fully comprehensive range of methods for a wide range of experimental cross types. We recently added multiple QTL mapping (MQM) to R/qtl. MQM adds higher statistical power to detect and disentangle the effects of multiple linked and unlinked QTL compared with many other methods. MQM for R/qtl adds many new features including improved handling of missing data, analysis of 10,000 s of molecular traits, permutation for determining significance thresholds for QTL and QTL hot spots, and visualizations for cis-trans and QTL interaction effects. MQM for R/qtl is the first free and open source implementation of MQM that is multi-platform, scalable and suitable for automated procedures and large genetical genomics datasets.
Availability: R/qtl is free and open source multi-platform software for the statistical language R, and is made available under the GPLv3 license. R/qtl can be installed from http://www.rqtl.org/. R/qtl queries should be directed at the mailing list, see http://www.rqtl.org/list/.
Contact: kbroman@biostat.wisc.edu.
Figures
References
-
- Broman KW, Sen S. A Guide to QTL Mapping with R/qtl. New York: Springer; 2009.
-
- Broman KW, et al. R/qtl: QTL mapping in experimental crosses. Bioinformatics. 2003;19:889–890. - PubMed
-
- de Mooij-van Malsen JG, et al. Evidence for epigenetic interactions for loci on mouse chromosome 1 regulating open field activity. Behav. Genet. 2009;39:176–182. - PubMed
-
- Fu J, et al. MetaNetwork: a computational tool for the genetic study of metabolism. Nat. Protocols. 2007;2:685–694. - PubMed
Publication types
MeSH terms
Grants and funding
LinkOut - more resources
Full Text Sources
Other Literature Sources
