

Intrarenal renin angiotensin system revisited: role of megalin-dependent endocytosis along the proximal nephron
- PMID: 20966072
- PMCID: PMC3009920
- DOI: 10.1074/jbc.M110.150284
Intrarenal renin angiotensin system revisited: role of megalin-dependent endocytosis along the proximal nephron
Abstract
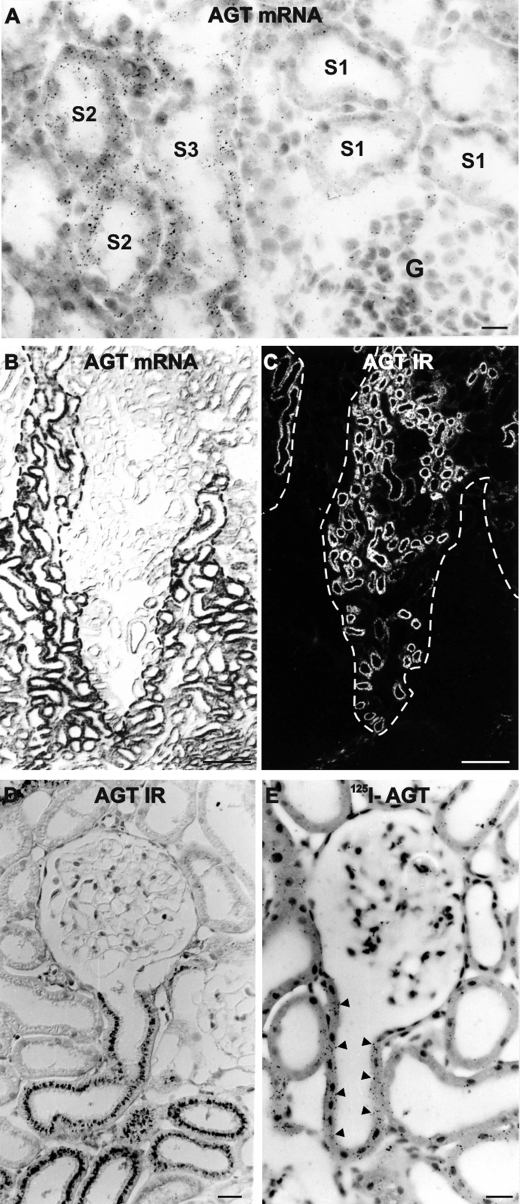
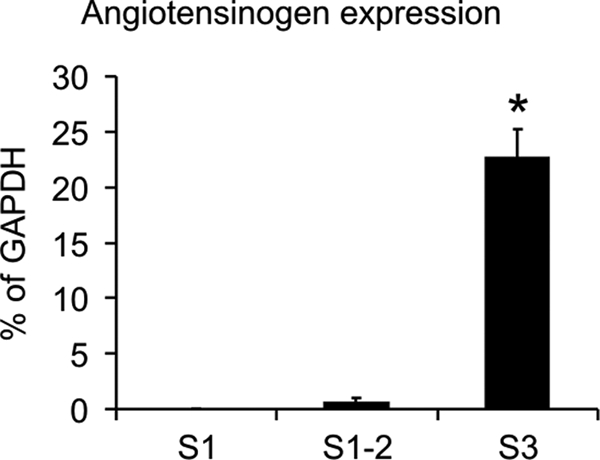
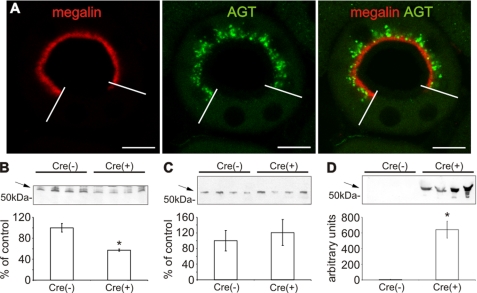
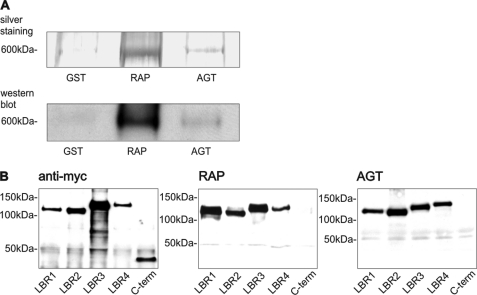
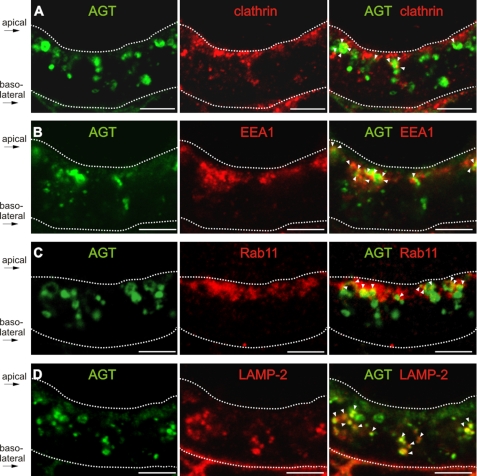
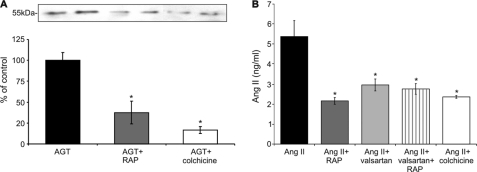
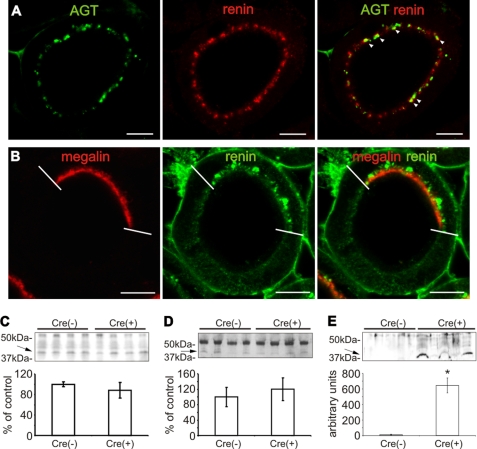
The existence of a local renin angiotensin system (RAS) of the kidney has been established. Angiotensinogen (AGT), renin, angiotensin-converting enzyme (ACE), angiotensin receptors, and high concentrations of luminal angiotensin II have been found in the proximal tubule. Although functional data have documented the relevance of a local RAS, the dualism between biosynthesis and endocytotic uptake of its components and their cellular processing has been incompletely understood. To resolve this, we have selectively analyzed their distribution, endocytosis, transcytosis, and biosynthesis in the proximal tubule. The presence of immunoreactive AGT, restricted to the early proximal tubule, was due to its retrieval from the ultrafiltrate and storage in endosomal and lysosomal compartments. Cellular uptake was demonstrated by autoradiography of radiolabeled AGT and depended on intact endocytosis. AGT was identified as a ligand of the multiple ligand-binding repeats of megalin. AGT biosynthesis was restricted to the proximal straight tubule, revealing substantial AGT mRNA expression. Transgenic AGT overexpression under the control of an endogenous promoter was also restricted to the late proximal tubule. Proximal handling of renin largely followed the patterns of AGT, whereas its local biosynthesis was not significant. Transcytotic transport of AGT in a proximal cell line revealed a 5% recovery rate after 1 h. ACE was expressed along late proximal brush-border membrane, whereas ACE2 was present along the entire segment. Surface expression of ACE and ACE2 differed as a function of endocytosis. Our data on the localization and cellular processing of RAS components provide new aspects of the functional concept of a "self-contained" renal RAS.
Figures

Similar articles
-
Megalin-Mediated Endocytosis in the Kidney Proximal Tubule: Relevance to Regulation of the Renal Renin-Angiotensin System.Nephron. 2023;147(3-4):244-249. doi: 10.1159/000526369. Epub 2022 Sep 12. Nephron. 2023. PMID: 36096093 Review.
-
Recent Updates on the Proximal Tubule Renin-Angiotensin System in Angiotensin II-Dependent Hypertension.Curr Hypertens Rep. 2016 Aug;18(8):63. doi: 10.1007/s11906-016-0668-z. Curr Hypertens Rep. 2016. PMID: 27372447 Free PMC article. Review.
-
Angiotensinogen and Megalin Interactions Contribute to Atherosclerosis-Brief Report.Arterioscler Thromb Vasc Biol. 2019 Feb;39(2):150-155. doi: 10.1161/ATVBAHA.118.311817. Arterioscler Thromb Vasc Biol. 2019. PMID: 30567480 Free PMC article.
-
Augmentation of angiotensinogen expression in the proximal tubule by intracellular angiotensin II via AT1a/MAPK/NF-кB signaling pathways.Am J Physiol Renal Physiol. 2016 May 1;310(10):F1103-12. doi: 10.1152/ajprenal.00350.2015. Epub 2016 Feb 10. Am J Physiol Renal Physiol. 2016. PMID: 26864937 Free PMC article.
-
Podocyte Injury Augments Intrarenal Angiotensin II Generation and Sodium Retention in a Megalin-Dependent Manner.Hypertension. 2019 Sep;74(3):509-517. doi: 10.1161/HYPERTENSIONAHA.118.12352. Epub 2019 Jul 29. Hypertension. 2019. PMID: 31352823 Free PMC article.
Cited by
-
Urinary markers of intrarenal renin-angiotensin system activity in vivo.Curr Hypertens Rep. 2013 Apr;15(2):81-8. doi: 10.1007/s11906-012-0326-z. Curr Hypertens Rep. 2013. PMID: 23296471 Review.
-
Urinary Angiotensinogen in Patients With Type 1 Diabetes With Microalbuminuria: Gender Differences and Effect of Intensive Insulin Therapy.Kidney Int Rep. 2022 Sep 20;7(12):2657-2667. doi: 10.1016/j.ekir.2022.09.010. eCollection 2022 Dec. Kidney Int Rep. 2022. PMID: 36506234 Free PMC article.
-
Role and Mechanism of the Renin-Angiotensin-Aldosterone System in the Onset and Development of Cardiorenal Syndrome.J Renin Angiotensin Aldosterone Syst. 2022 Jan 24;2022:3239057. doi: 10.1155/2022/3239057. eCollection 2022. J Renin Angiotensin Aldosterone Syst. 2022. PMID: 35111237 Free PMC article. Review.
-
Deficiency of angiotensinogen in hepatocytes markedly decreases blood pressure in lean and obese male mice.Hypertension. 2015 Oct;66(4):836-42. doi: 10.1161/HYPERTENSIONAHA.115.06040. Epub 2015 Aug 24. Hypertension. 2015. PMID: 26303292 Free PMC article.
-
Antenatal betamethasone exposure is associated with lower ANG-(1-7) and increased ACE in the CSF of adult sheep.Am J Physiol Regul Integr Comp Physiol. 2013 Oct 1;305(7):R679-88. doi: 10.1152/ajpregu.00321.2013. Epub 2013 Aug 15. Am J Physiol Regul Integr Comp Physiol. 2013. PMID: 23948771 Free PMC article.
References
-
- Quan A., Baum M. (2000) Nephron 84, 103–110 - PubMed
-
- Kobori H., Nangaku M., Navar L. G., Nishiyama A. (2007) Pharmacol. Rev. 59, 251–287 - PubMed
-
- Braam B., Mitchell K. D., Fox J., Navar L. G. (1993) Am. J. Physiol. 264, F891–F898 - PubMed
-
- Le T. H., Coffman T. M. (2008) Curr. Opin. Nephrol. Hypertens. 17, 57–63 - PubMed
-
- Guyton A. C. (1991) Science 252, 1813–1816 - PubMed
MeSH terms
Substances
LinkOut - more resources
Full Text Sources
Miscellaneous
