

Imaging of mobile long-lived nanoplatforms in the live cell plasma membrane
- PMID: 20966075
- PMCID: PMC3009904
- DOI: 10.1074/jbc.M110.182121
Imaging of mobile long-lived nanoplatforms in the live cell plasma membrane
Abstract
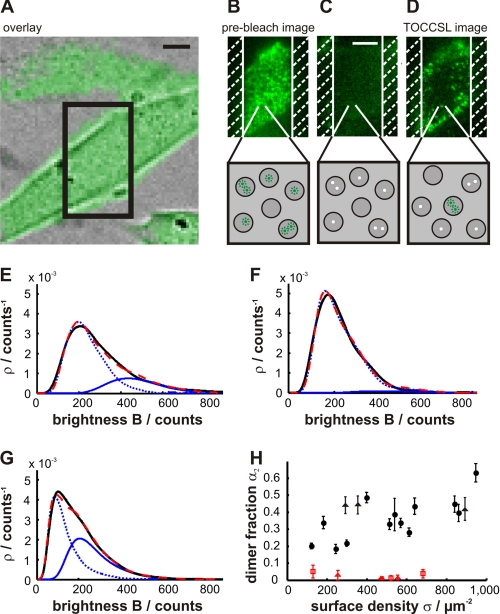
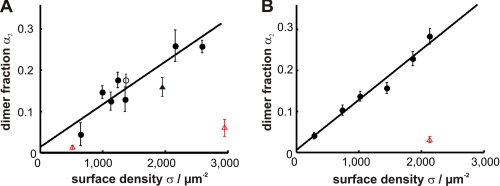
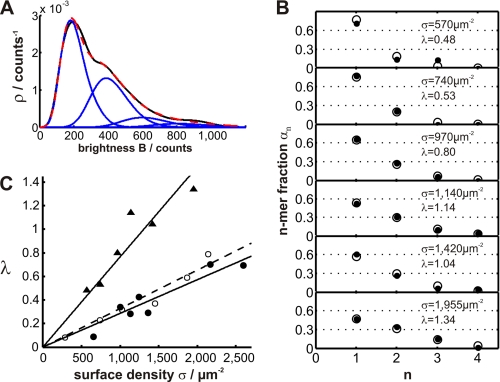
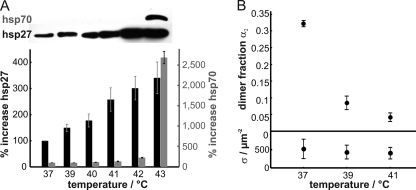
The plasma membrane has been hypothesized to contain nanoscopic lipid platforms, which are discussed in the context of "lipid rafts" or "membrane rafts." Based on biochemical and cell biological studies, rafts are believed to play a crucial role in many signaling processes. However, there is currently not much information on their size, shape, stability, surface density, composition, and heterogeneity. We present here a method that allows for the first time the direct imaging of nanoscopic long-lived platforms with raft-like properties diffusing in the live cell plasma membrane. Our method senses these platforms by their property to assemble a characteristic set of fluorescent marker proteins or lipids on a time scale of seconds. A special photobleaching protocol was used to reduce the surface density of labeled mobile platforms down to the level of well isolated diffraction-limited spots without altering the single spot brightness. The statistical distribution of probe molecules per platform was determined by single molecule brightness analysis. For demonstration, we used the consensus raft marker glycosylphosphatidylinositol-anchored monomeric GFP and the fluorescent lipid analog BODIPY-G(M1), which preferentially partitions into liquid-ordered phases. For both markers, we found cholesterol-dependent homo-association in the plasma membrane of living CHO and Jurkat T cells in the resting state, thereby demonstrating the existence of small, mobile, long-lived platforms containing these probes. We further applied the technology to address structural changes in the plasma membrane during fever-type heat shock: at elevated temperatures, the glycosylphosphatidylinositol-anchored monomeric GFP homo-association disappeared, accompanied by an increase in the expression of the small heat shock protein Hsp27.
Figures
Similar articles
-
Membrane-lipid therapy in operation: the HSP co-inducer BGP-15 activates stress signal transduction pathways by remodeling plasma membrane rafts.PLoS One. 2011;6(12):e28818. doi: 10.1371/journal.pone.0028818. Epub 2011 Dec 12. PLoS One. 2011. PMID: 22174906 Free PMC article.
-
Oxidized Phospholipids Inhibit the Formation of Cholesterol-Dependent Plasma Membrane Nanoplatforms.Biophys J. 2016 Jan 5;110(1):205-13. doi: 10.1016/j.bpj.2015.11.018. Biophys J. 2016. PMID: 26745423 Free PMC article.
-
Differential insertion of GPI-anchored GFPs into lipid rafts of live cells.FASEB J. 2005 Jan;19(1):73-5. doi: 10.1096/fj.03-1338fje. Epub 2004 Oct 29. FASEB J. 2005. PMID: 15516372
-
Distribution of lipid raft markers in live cells.Biochem Soc Trans. 2004 Nov;32(Pt 5):673-5. doi: 10.1042/BST0320673. Biochem Soc Trans. 2004. PMID: 15493984 Review.
-
Unraveling of Lipid Raft Organization in Cell Plasma Membranes by Single-Molecule Imaging of Ganglioside Probes.Adv Exp Med Biol. 2018;1104:41-58. doi: 10.1007/978-981-13-2158-0_3. Adv Exp Med Biol. 2018. PMID: 30484243 Review.
Cited by
-
APP and Bace1: Differential effect of cholesterol enrichment on processing and plasma membrane mobility.iScience. 2023 Apr 11;26(5):106611. doi: 10.1016/j.isci.2023.106611. eCollection 2023 May 19. iScience. 2023. PMID: 37128606 Free PMC article.
-
There Is No Simple Model of the Plasma Membrane Organization.Front Cell Dev Biol. 2016 Sep 29;4:106. doi: 10.3389/fcell.2016.00106. eCollection 2016. Front Cell Dev Biol. 2016. PMID: 27747212 Free PMC article. Review.
-
Determination of the Membrane Environment of CD59 in Living Cells.Biomolecules. 2018 May 17;8(2):28. doi: 10.3390/biom8020028. Biomolecules. 2018. PMID: 29772810 Free PMC article.
-
A role for the thermal environment in defining co-stimulation requirements for CD4(+) T cell activation.Cell Cycle. 2015;14(14):2340-54. doi: 10.1080/15384101.2015.1049782. Cell Cycle. 2015. PMID: 26131730 Free PMC article.
-
The plasma membrane as an adaptable fluid mosaic.Biochim Biophys Acta Biomembr. 2023 Mar;1865(3):184114. doi: 10.1016/j.bbamem.2022.184114. Epub 2022 Dec 26. Biochim Biophys Acta Biomembr. 2023. PMID: 36581017 Free PMC article. Review.
References
-
- Simons K., Toomre D. (2000) Nat. Rev. Mol. Cell Biol. 1, 31–39 - PubMed
-
- Lingwood D., Simons K. (2010) Science 327, 46–50 - PubMed
-
- Simons K., Ikonen E. (1997) Nature 387, 569–572 - PubMed
-
- Kusumi A., Koyama-Honda I., Suzuki K. (2004) Traffic 5, 213–230 - PubMed
-
- Pike L. J. (2006) J. Lipid Res. 47, 1597–1598 - PubMed
Publication types
MeSH terms
Substances
Grants and funding
LinkOut - more resources
Full Text Sources
Molecular Biology Databases
Research Materials
Miscellaneous
