. 2010 Dec 17;285(51):40351-61.
doi: 10.1074/jbc.M110.186072. Epub 2010 Oct 21.

Structural basis for hormone recognition by the Human CRFR2{alpha} G protein-coupled receptor

Affiliations

Structural basis for hormone recognition by the Human CRFR2{alpha} G protein-coupled receptor

Kuntal Pal et al. J Biol Chem. .

Abstract

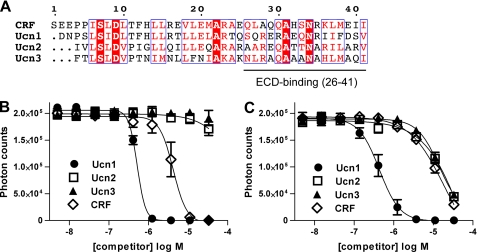
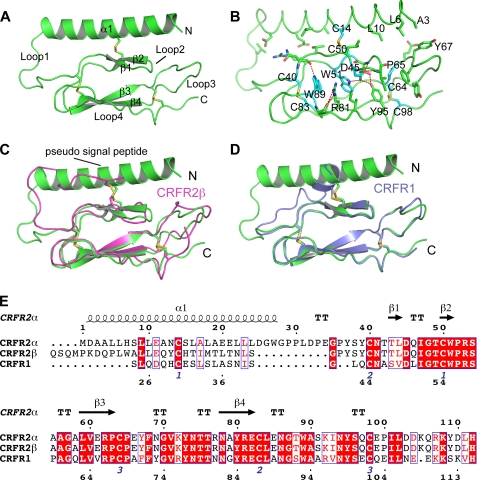
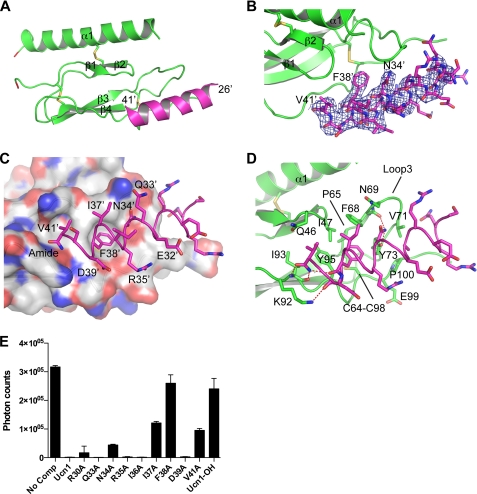
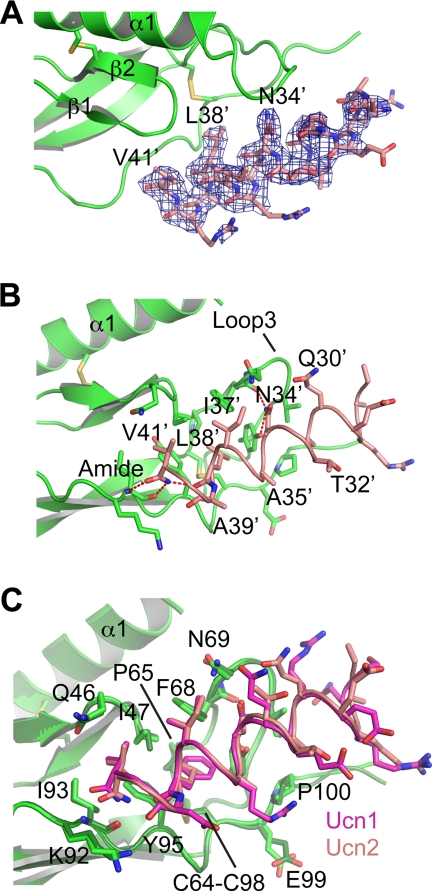
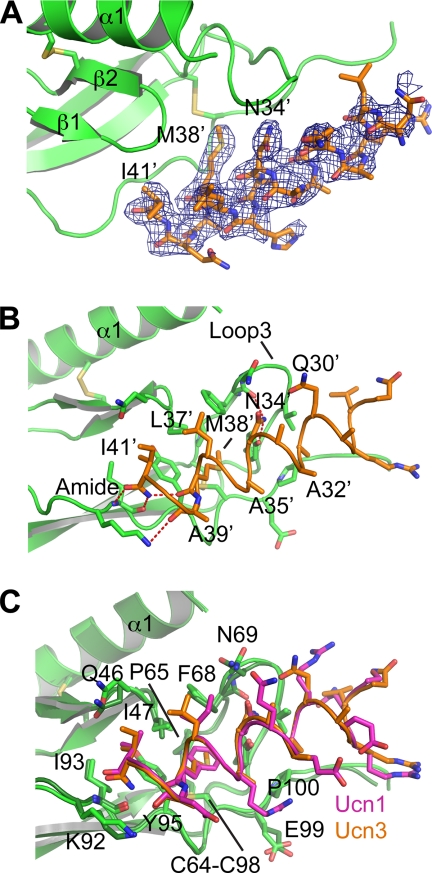
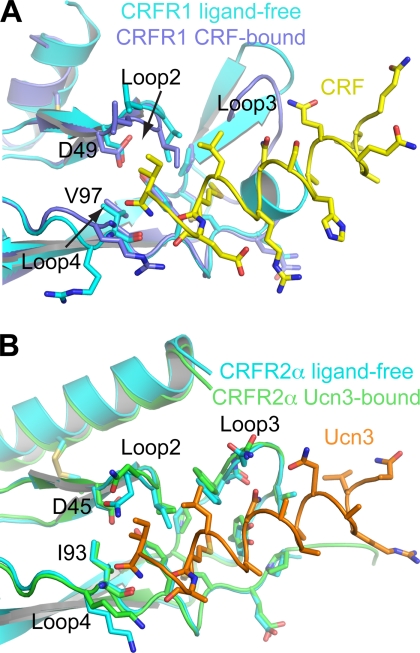
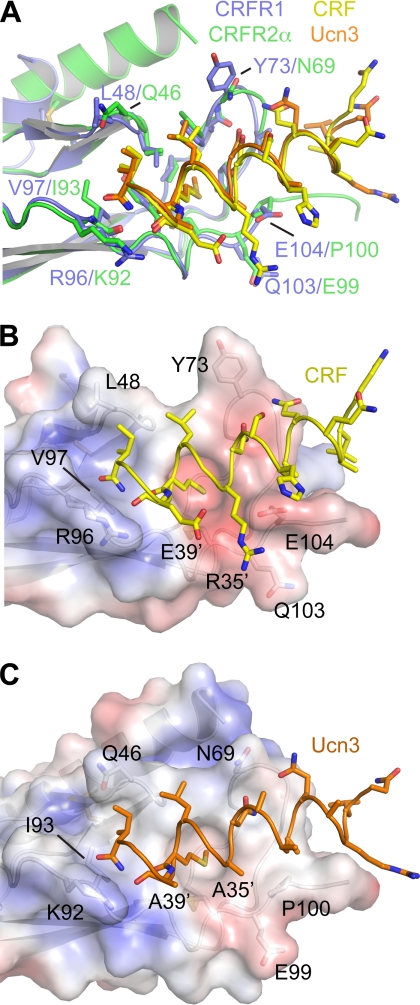
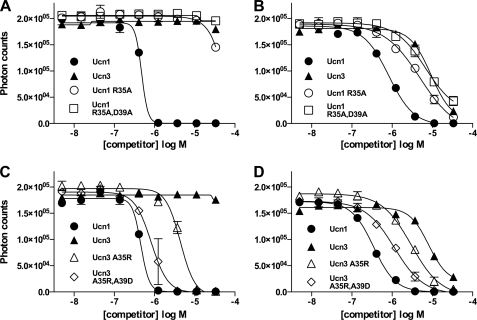
The mammalian corticotropin releasing factor (CRF)/urocortin (Ucn) peptide hormones include four structurally similar peptides, CRF, Ucn1, Ucn2, and Ucn3, that regulate stress responses, metabolism, and cardiovascular function by activating either of two related class B G protein-coupled receptors, CRFR1 and CRFR2. CRF and Ucn1 activate both receptors, whereas Ucn2 and Ucn3 are CRFR2-selective. The molecular basis for selectivity is unclear. Here, we show that the purified N-terminal extracellular domains (ECDs) of human CRFR1 and the CRFR2α isoform are sufficient to discriminate the peptides, and we present three crystal structures of the CRFR2α ECD bound to each of the Ucn peptides. The CRFR2α ECD forms the same fold observed for the CRFR1 and mouse CRFR2β ECDs but contains a unique N-terminal α-helix formed by its pseudo signal peptide. The CRFR2α ECD peptide-binding site architecture is similar to that of CRFR1, and binding of the α-helical Ucn peptides closely resembles CRF binding to CRFR1. Comparing the electrostatic surface potentials of the ECDs suggests a charge compatibility mechanism for ligand discrimination involving a single amino acid difference in the receptors (CRFR1 Glu104/CRFR2α Pro-100) at a site proximate to peptide residue 35 (Arg in CRF/Ucn1, Ala in Ucn2/3). CRFR1 Glu-104 acts as a selectivity filter preventing Ucn2/3 binding because the nonpolar Ala-35 is incompatible with the negatively charged Glu-104. The structures explain the mechanisms of ligand recognition and discrimination and provide a molecular template for the rational design of therapeutic agents selectively targeting these receptors.


Figures

FIGURE 1.
FIGURE 1.
Binding of CRF/urocortin family peptides to the purified CRFR1 and CRFR2α extracellular domains. A, amino acid sequence alignment of the human CRF/Ucn family peptides is shown. B and C, competition curves show the ability of CRF-(26–41) and the equivalent fragments of Ucn1, -2, and -3 to inhibit the association of biotin-CRF-(12–41) and the MBP-CRFR1-(24–119)-His6 (B) or MBP-CRFR2α-(1–117)-His6 (C) fusion proteins in the AlphaScreen assay. The data represent the average of duplicate samples.
FIGURE 2.
FIGURE 2.
Structure of the CRFR2α extracellular domain and comparison to CRFR2β and CRFR1. A, a ribbon diagram shows the 2.5 Å resolution structure of the human CRFR2α ECD from molecule A of the Ucn3-bound crystal form. This molecule did not have a bound Ucn3 peptide and is, thus, in the ligand-free state. MBP is not shown for clarity. B, CRFR2α ECD shows selected side chains. The residues with carbon atoms colored cyan are strictly conserved among all class B GPCRs. Red dashes indicate hydrogen bonds. C, shown is a comparison of the CRFR2α ECD with the mouse CRFR2β ECD from the ligand-free NMR solution structure (PDB code 2JNC). D, shown is a comparison of the CRFR2α ECD with the human CRFR1 ECD from the crystal structure of CRFR1 bound to CRF (PDB code 3EHU). For clarity, the CRF peptide is not shown. E, amino acid sequence alignment of human CRFR2α, CRFR2β, and CRFR1 is shown. Secondary structural elements of CRFR2α are shown above the sequence. The residue numbering on top corresponds to CRFR2α, and the numbering on the bottom corresponds to CRFR1. The disulfide bond connectivity is indicated below the sequences in blue numbering. The signal peptide sequences of CRFR2β and CRFR1 are not shown.
FIGURE 3.
FIGURE 3.
Structure of the CRFR2α ECD-Ucn1 complex at 2.75 Å resolution. A, a ribbon diagram shows the structure of the CRFR2α ECD (molecule D) in complex with Ucn1 (molecule F). The ECD is green, and the peptide is magenta. Several residues in loop 1 of the ECD were not visible in the electron density maps. The break in the chain is indicated with red. MBP is not shown for clarity. B, the 2mFo − DFc electron density map for the peptide is shown as a blue mesh contoured at 1 σ. C, a semitransparent molecular surface is shown over the ECD ribbon diagram. Carbon atoms are colored white, oxygen atoms are red, nitrogen atoms are blue, and sulfur atoms are orange. The Ucn1 peptide is shown as a magenta coil with selected side chains as sticks. D, shown is a detailed view of the complex with selected side chains shown as sticks. The red dashes indicate hydrogen bonds. E, shown is a single point competition AlphaScreen assay assessing the ability of the indicated Ucn1-(26–41) peptides (10 μm) to inhibit the association of Biotin-CRF-(12–41) and MBP-CRFR2α-(1–117)-His6. Ucn1-OH denotes the peptide with WT amino acid sequence and a C-terminal carboxylate group instead of the amide group. The data represent the average of duplicate samples.
FIGURE 4.
FIGURE 4.
Structure of the CRFR2α ECD-Ucn2 complex at 2.72 Å resolution. A, the 2mFo − DFc electron density map for the Ucn2 peptide is shown as a blue mesh contoured at 1 σ. The complex shown is that of molecule D (ECD) and molecule F (Ucn2). B, a detailed view of the peptide-receptor interface with selected side chains is shown as sticks. The receptor is green, and the peptide is salmon. C, structural overlay of the Ucn2- and Ucn1-bound structures is shown. The ECD from the Ucn2-bound structure is green, and the ECD from the Ucn1-bound structure is dark forest green.
FIGURE 5.
FIGURE 5.
Structure of the CRFR2α ECD-Ucn3 complex at 2.5 Å resolution. A, the 2mFo − DFc electron density map for the Ucn3 peptide is shown as a blue mesh contoured at 1 σ. The complex shown is that of molecule B (ECD) and molecule C (Ucn3). B, a detailed view of the peptide-receptor interface with selected side chains is shown as sticks. The receptor is green, and the peptide is orange. C, structural overlay of the Ucn3- and Ucn1-bound structures is shown. The ECD from the Ucn3-bound structure is green, and the ECD from the Ucn1-bound structure is dark forest green.
FIGURE 6.
FIGURE 6.
Comparison of the ligand-free and ligand-bound states of CRFR1 and CRFR2α. A, shown is structural overlay of the ligand-free (2.75 Å resolution; PDB code 3EHS) and CRF-bound (1.96 Å resolution; PDB code 3EHU) structures of the CRFR1 ECD. The arrows indicate the direction of the shifts observed for loop 2 and loop 4 upon CRF binding. Differences in loop 3 cannot be attributed to ligand effects because a crystal packing interaction in the ligand-free structure caused loop 3 to form a presumably unnatural conformation. B, structural overlay of the ligand-free (molecule A) and Ucn3-bound (molecules B and C) structures of the CRFR2α ECD is shown.
FIGURE 7.
FIGURE 7.
Comparison of the CRFR2α ECD-Ucn3 and CRFR1 ECD-CRF complexes. A, structural overlay of the CRFR2α ECD-Ucn3 complex (2.5 Å resolution) with the CRFR1 ECD-CRF complex (1.9 Å resolution; PDB code 3EHU) is shown. The CRFR2α ECD-Ucn3 complex is that of molecules B and C, respectively. The ECDs are shown as ribbon diagrams with side chains that form the peptide-binding site shown as sticks. The peptides are shown as coils with selected side chains as sticks. The six peptide-binding site residues that differ between CRFR1 and CRFR2α are labeled in color-coded format. CRFR1 residue Tyr-73 exhibited no side chain electron density in the 3EHU structure and was, thus, trimmed back to the β carbon atom in 3EHU. For clarity, here the Tyr-73 side chain was added in the most sensible rotamer conformation. B, the electrostatic surface potential of the CRFR1 ECD was calculated with APBS assuming a solvent of 150 mm salt. A semitransparent molecular surface colored according to charge is shown over the CRFR1 ribbon diagram. The color ramp is from −5 (red) to +5 (blue) kT/e. The side chains of the six peptide-binding site residues that differ between CRFR1 and CRFR2α are shown as sticks and labeled. CRF is shown as a yellow coil. To permit better comparison with CRFR2α, residues 105–106 of CRFR1, which were not visible in the electron density maps for 3EHU, were added to the ECD in the same conformation observed for residues 101–102 of CRFR2α. These residues are strictly conserved between CRFR1 and CRFR2α (Fig. 2E). C, shown is the electrostatic surface potential of the CRFR2α ECD, depicted as in panel B. Ucn3 is shown as an orange coil.
FIGURE 8.
FIGURE 8.
Binding of Ucn1/3 swap peptides to the CRFR1 and CRFR2α ECDs. Competition binding curves show the ability of the indicated peptides to inhibit the association of biotin-CRF-(12–41) and the MBP-CRFR1.24–119-His6 (A and C) or MBP-CRFR2α-(1–117)-His6 (B and D) fusion proteins in the AlphaScreen assay. The data represent the average of duplicate samples.

Similar articles

Cited by

References

    1. Bale T. L., Vale W. W. (2004) Annu. Rev. Pharmacol. Toxicol. 44, 525–557 - PubMed
    1. Hauger R. L., Risbrough V., Brauns O., Dautzenberg F. M. (2006) CNS Neurol. Disord Drug Targets 5, 453–479 - PMC - PubMed
    1. Hillhouse E. W., Grammatopoulos D. K. (2006) Endocr. Rev. 27, 260–286 - PubMed
    1. Chen R., Lewis K. A., Perrin M. H., Vale W. W. (1993) Proc. Natl. Acad. Sci. U.S.A. 90, 8967–8971 - PMC - PubMed
    1. Hsu S. Y., Hsueh A. J. (2001) Nat. Med. 7, 605–611 - PubMed

Publication types

MeSH terms