. 2011 Jan 13;117(2):440-50.
doi: 10.1182/blood-2010-03-273011. Epub 2010 Oct 21.

SIRT1 deficiency compromises mouse embryonic stem cell hematopoietic differentiation, and embryonic and adult hematopoiesis in the mouse

Affiliations

SIRT1 deficiency compromises mouse embryonic stem cell hematopoietic differentiation, and embryonic and adult hematopoiesis in the mouse

Xuan Ou et al. Blood. .

Abstract

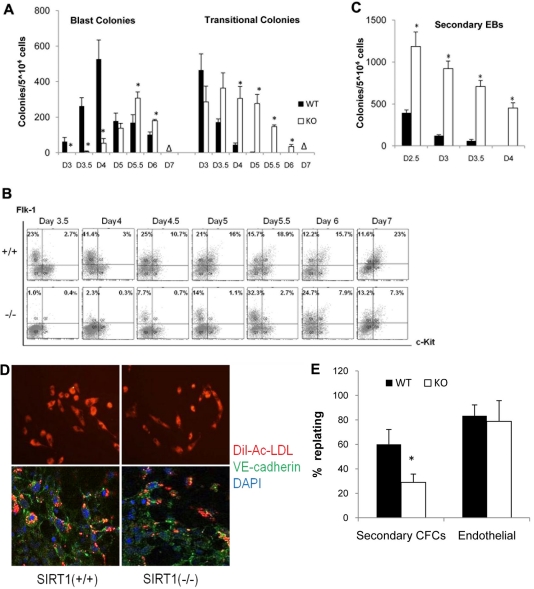
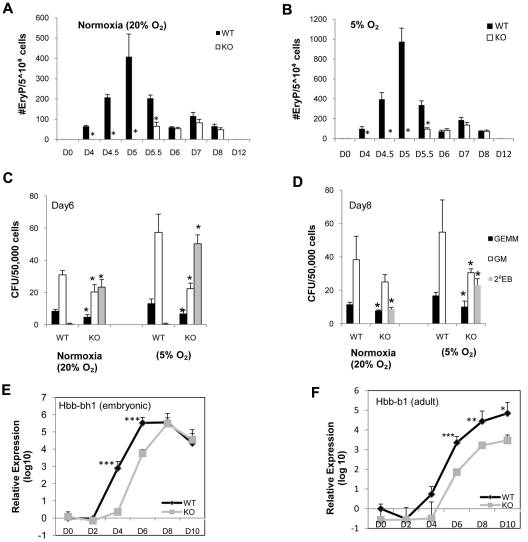
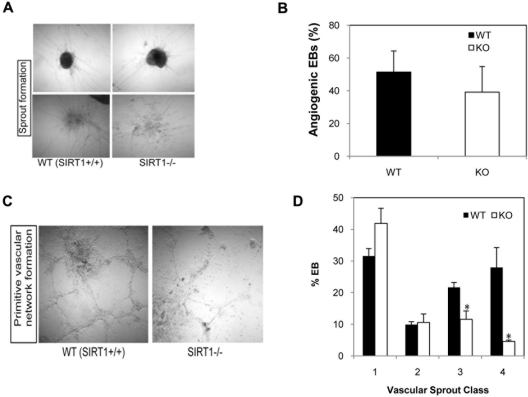
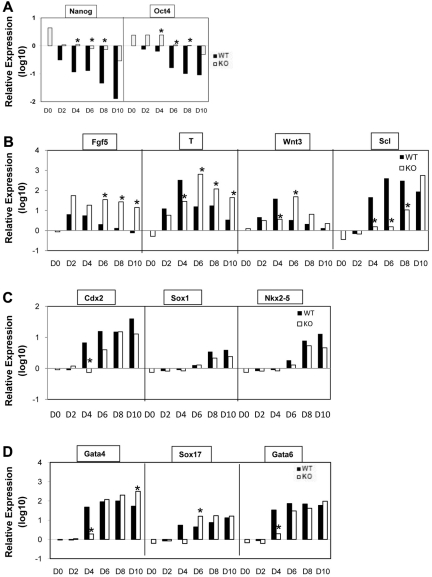
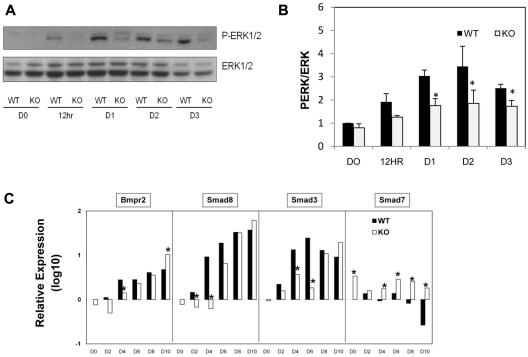
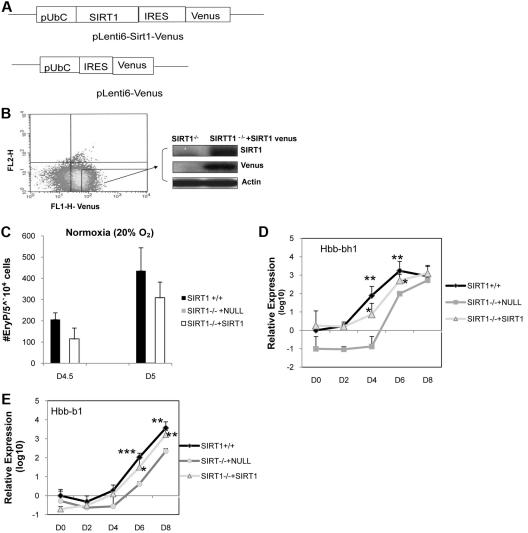
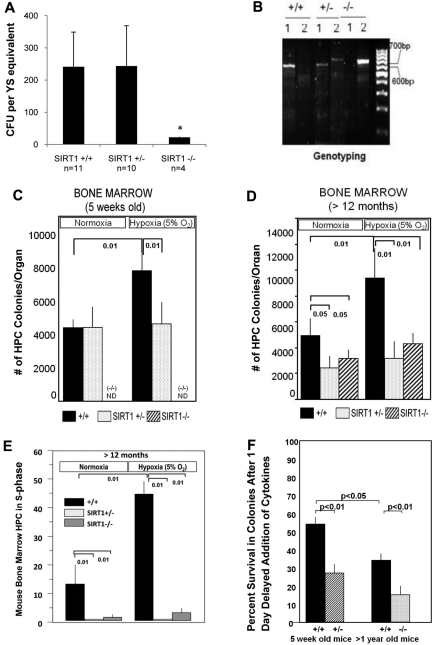
SIRT1 is a founding member of a sirtuin family of 7 proteins and histone deacetylases. It is involved in cellular resistance to stress, metabolism, differentiation, aging, and tumor suppression. SIRT1(-/-) mice demonstrate embryonic and postnatal development defects. We examined hematopoietic and endothelial cell differentiation of SIRT1(-/-) mouse embryonic stem cells (ESCs) in vitro, and hematopoietic progenitors in SIRT1(+/+)(+/-), and (-/-) mice. SIRT1(-/-) ESCs formed fewer mature blast cell colonies. Replated SIRT1(-/-) blast colony-forming cells demonstrated defective hematopoietic potential. Endothelial cell production was unaltered, but there were defects in formation of a primitive vascular network from SIRT1(-/-)-derived embryoid bodies. Development of primitive and definitive progenitors derived from SIRT1(-/-) ESCs were also delayed and/or defective. Differentiation delay/defects were associated with delayed capacity to switch off Oct4, Nanog and Fgf5 expression, decreased β-H1 globin, β-major globin, and Scl gene expression, and reduced activation of Erk1/2. Ectopic expression of SIRT1 rescued SIRT1(-/-) ESC differentiation deficiencies. SIRT1(-/-) yolk sacs manifested fewer primitive erythroid precursors. SIRT1(-/-) and SIRT1(+/-) adult marrow had decreased numbers and cycling of hematopoietic progenitors, effects more apparent at 5%, than at 20%, oxygen tension, and these progenitors survived less well in vitro under conditions of delayed growth factor addition. This suggests a role for SIRT1 in ESC differentiation and mouse hematopoiesis.


Figures

Figure 1
Figure 1
Blast cell colony development from WT (SIRT1+/+) and SIRT1-deficient (SIRT1−/−) ESCs. (A) Kinetics of blast and transitional colony development in SIRT1+/+ and SIRT1−/− EBs. Data are shown as mean ± SD. N = 3; *P < .01. Days (D) of differentiation are indicated. Δ = no colony grown. (B) fluorescence-activated cell sorting analysis of Flk1 and c-Kit expression on SIRT1+/+ and SIRT1−/− EB-derived cells. Days of differentiation are indicated. Numbers in each quadrant represent the percent of total population in each fraction. (C) Secondary EB colonies generated by SIRT1+/+ and SIRT1−/− EB cells. Days of differentiation are indicated. Data are shown as mean ± SD. N = 3; *P < .01. (D) Immunostaining and Dil-Ac-LDL uptake of adhesive cells generated from a single blast colony from SIRT1+/+ and SIRT1−/− EB-derived cells. VE-cadherin expression is indicated by green fluorescence and LDL uptake by red fluorescence. (E) Evaluation of the hematopoietic and endothelial potentials of BL-CFCs. The number of colonies that yielded secondary CFCs or adherent endothelial cells is divided by the total number of replated colonies. Bars represent SEM number from at least 3 experiments; *P < .01.
Figure 2
Figure 2
Kinetic analysis of primitive and definitive hematopoietic colonies generated from WT (SIRT1+/+) and knockout (KO; SIRT1−/−) EB cells under normoxia (20% O2) and 5%O2. Primitive erythroid colonies generated from SIRT1+/+ and SIRT1−/− EB-derived cells under (A) normoxia and (B) lower (5%) O2 tension. Definitive GEMM, multilineage progenitors of granulocytes, erythroid cells, macrophages, megakaryocytes; GM, multilineage progenitors of granulocytes and macrophages; and secondary EBs generated from SIRT1+/+ and SIRT1−/− EB-derived cells under normoxia condition and lower (5%) O2 tension at day 6 (C) and day 8 (D). Data are shown as mean ± SD. N = 3; *P < .05. Relative mRNA expression of embryonic globin (E) and adult globin (F) genes from SIRT1+/+ and SIRT1−/− day 0, 2, 4, 6, 8, and 10 EBs by real-time RT-PCR. Error bars indicate SDs from the average of 3 independent experiments, each performed in triplicate; ***P < .001; **P < .01; *P < .05.
Figure 3
Figure 3
Effect of SIRT1 deletion on in vitro vascular sprout formation in differentiating EBs. (A) Representative micrographs of 3-dimensional in vitro angiogenesis assays with collagen gel-embedded spheroids generated from WT (SIRT1+/+) or KO (SIRT1−/−) day 6 EBs. (B) Analysis of the percentage of angiogenic EBs was performed after 8 days of secondary culture in collagen gel. (C) Representative micrographs of in vitro matrigel assays with SIRT1+/+ or SIRT1−/− day 6 EBs. (D) Percentage of each class of vascular sprouting (see “Vascular sprout formation assay”). Data are shown as mean ± SEM. N = 3; *P = .01-.04. Image acquisition details: Nikon Diaphot microscope, 10×/0.25 numeric aperature objective lens, Nikon F3 camera, NIS-Elements D2.30 software.
Figure 4
Figure 4
Gene expression analysis of WT (SIRT1+/+) and KO (SIRT1−/−) EBs by real-time PCR analysis. (A) Quantitative RT-PCR (qRT-PCR) analysis of stem cell marker Oct4 and Nanog mRNA levels in day 0-10 SIRT1+/+ and SIRT1−/− EBs. (B) qRT-PCR analysis of mRNA levels of epiblast marker Fgf5, mesoderm markers T, Wnt3, and transcription factor Tal1/Scl in day 0-10 SIRT1+/+ and SIRT1−/− EBs. (C) qRT-PCR analysis of mRNA levels of trophectoderm marker Cdx2, neuroectoderm marker Sox1, and cardiac lineage marker Nkx2-5 in day 0-10 SIRT1+/+ and SIRT1−/− EBs. (D) qRT-PCR analysis of mRNA levels of endoderm/mesoderm markers GATA-4, GATA6, and Sox17 in day 0-10 SIRT1+/+ and SIRT1−/− EBs. Day (D) 0 represents undifferentiated ESCs. Graphs in panels A through D were plotted in logarithmic scale. Data are relative to SIRT1+/+ D0 control and mRNA levels of each gene were compared between SIRT1+/+ and SIRT1−/− EBs at each time point. Results were the average of 3 independent experiments, each performed in triplicate. *P < .05.
Figure 5
Figure 5
Western Blot analysis of Erk signaling pathways and qRT-PCR analysis of gene expression in day 0-10 SIRT1+/+ and SIRT1−/− EBs. (A) Representative blot and (B) quantification showing phosphorylation of Erk and Erk1/2 protein expression at different time points during EB development. Data are shown as mean ± SEM. N = 3; *P < .05. (C) qRT-PCR analysis of mRNA levels of genes (BMPr2, Smad8, Smad3, Smad7) involved in BMP pathways in day 0-10 SIRT1+/+ and SIRT1−/− EBs. D0 represents undifferentiated ESCs. Graphs in panel C were plotted in logarithmic scale. Data are relative to SIRT1+/+ D0 control and mRNA levels of each gene were compared between SIRT1+/+ and SIRT1−/− EBs at each time point. Results were of 3 independent experiments performed in triplicate. *P < .05.
Figure 6
Figure 6
Ectopic expression of exogenous SIRT1 in SIRT1−/− ESCs. (A) Diagram of pLenti6-SIRT1-Venus lentiviral vector. (B) Transfected SIRT1−/− ESCs were sorted, and expression of SIRT1 protein was determined by Western blotting. (C) Number of primitive erythroid colonies generated by day 4.5 and day 5 SIRT1+/+, SIRT1−/− ESCs. (D-E) qRT-PCR analysis of mRNA levels of embryonic globin (Hbb-bh1) and adult globin (Hbb-b1) in day (D) 0-8 SIRT1+/+, SIRT1−/− plus null and SIRT1−/− +SIRT1 venus EBs. Data represent fold changes in EBs, relative to SIRT1+/+ D0 control and comparison between SIRT1+/+, SIRT1−/− plus null, and SIRT1−/− plus SIRT1 EBs at each time point. Results are average of 3 independent experiments. Each data point denotes 6 biological replicates; *P < .05; **P < .01; ***P < .001.
Figure 7
Figure 7
Hematopoietic progenitor cell colony forming assay from yolk sac and bone marrow of SIRT1+/+, SIRT1+/−, and SIRT1−/− mice. (A) Primitive erythroid colony formation from yolk sac (YS) cells generated from E8 to E8.25 SIRT1+/+, SIRT+/−, and SIRT1−/− embryos (SIRT1+/+, n = 11; heterozygous, n = 10; SIRT1−/−, n = 4) were grown in methylcellulose-based medium. Data are shown as mean ± SD; *P < .01. (B) PCR shows the genotyping of SIRT1 mutant embryos. The primers are: forward-5′-TCCTTGCCACAGTCACTCAC-3′, reverse for wild-type 5′-CATCTAAACTTTGTTGGCTGC-3′, reverse for deletion 5′-ACAGTCCCATTCCCATACC-3′. (C) Hematopoietic progenitor cell colony formation from bone marrow of 5-week-old SIRT1 heterozygote (SIRT1+/−) or wild-type controls (SIRT1+/+) under normoxia (20% O2) and 5% O2 conditions. Data are shown as mean ± SD; *P < .01; ND = SIRT1−/− cells were not available for use and were not done. (D) Hematopoietic progenitor cell colony formation from bone marrow of 12-month-old SIRT1 heterozygote (SIRT1+/−) or homozygote (SIRT1−/−) null mice or from wild-type controls (SIRT1+/+) under normoxia (20% O2) or 5% O2 conditions. (E) Cycling status of mouse bone marrow progenitor cells generated from 12-month-old SIRT1+/+, SIRT1+/−, and SIRT1−/− mice under normoxia (20% O2) and 5% O2 conditions. This shows percent progenitors in DNA synthesis (S-phase) as determined by high specific activity tritiated thymidine kill technique. P values were calculated with Student t test. ND = not done. Data are the average of 3-5 mice/group. (F) Survival of hematopoietic progenitor cells in vitro after 1 day delayed addition of cytokines as denoted by decreased colony formation. Results are expressed as mean ± ISEM for 4-5 mice per group.

References

    1. Smith AG, Heath JK, Donaldson DD, et al. Inhibition of pluripotential embryonic stem cell differentiation by purified polypeptides. Nature. 1988;336(6200):688–690. - PubMed
    1. Keller GM. In vitro differentiation of embryonic stem cells. Curr Opin Cell Biol. 1995;7(6):862–869. - PubMed
    1. Choi K, Kennedy M, Kazarov A, Papadimitriou JC, Keller G. A common precursor for hematopoietic and endothelial cells. Development. 1998;125(4):725–732. - PubMed
    1. Frye RA. Phylogenetic classification of prokaryotic and eukaryotic Sir2-like proteins. Biochem Biophys Res Commun. 2000;273(2):793–798. - PubMed
    1. Guarente L, Picard F. Calorie restriction—the SIR2 connection. Cell. 2005;120(4):473–482. - PubMed

Publication types

MeSH terms