. 2011 Jan 13;117(2):661-8.
doi: 10.1182/blood-2010-06-290338. Epub 2010 Oct 21.

The interplay between tissue plasminogen activator domains and fibrin structures in the regulation of fibrinolysis: kinetic and microscopic studies

Affiliations

The interplay between tissue plasminogen activator domains and fibrin structures in the regulation of fibrinolysis: kinetic and microscopic studies

Colin Longstaff et al. Blood. .

Abstract

Regulation of tissue-type plasminogen activator (tPA) depends on fibrin binding and fibrin structure. tPA structure/function relationships were investigated in fibrin formed by high or low thrombin concentrations to produce a fine mesh and small pores, or thick fibers and coarse structure, respectively. Kinetics studies were performed to investigate plasminogen activation and fibrinolysis in the 2 types of fibrin, using wild-type tPA (F-G-K1-K2-P, F and K2 binding), K1K1-tPA (F-G-K1-K1-P, F binding), and delF-tPA (G-K1-K2-P, K2 binding). There was a trend of enzyme potency of tPA > K1K1-tPA > delF-tPA, highlighting the importance of the finger domain in regulating activity, but the differences were less apparent in fine fibrin. Fine fibrin was a better surface for plasminogen activation but more resistant to lysis. Scanning electron and confocal microscopy using orange fluorescent fibrin with green fluorescent protein-labeled tPA variants showed that tPA was strongly associated with agglomerates in coarse but not in fine fibrin. In later lytic stages, delF-tPA-green fluorescent protein diffused more rapidly through fibrin in contrast to full-length tPA, highlighting the importance of finger domain-agglomerate interactions. Thus, the regulation of fibrinolysis depends on the starting nature of fibrin fibers and complex dynamic interaction between tPA and fibrin structures that vary over time.


Figures
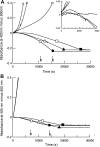
Figure 1
Figure 1
Fibrinolysis and plasminogen activation kinetics by tPA (circles), K1K1-tPA (triangles), and delF-tPA (squares) in fibrin clots prepared using different thrombin concentrations. Thrombin concentrations used to form the clots were 5nM (A, fibrin5) and 100nM (B, fibrin100). Representative data using 0.075nM tPA are shown for plasmin generation measured by hydrolysis of S-2251 at 405 nm (positive absorbance change) and simultaneously for lysis of fibrin clots (negative absorbance change, in the absence of S-2251). Large open symbols represent the time points to 50% lysis of each clot; and the solid symbols show the time points for 100% lysis. Small symbols are included on plasminogen activation curves for identification purposes. The 3 plasminogen activation curves for the tPA variants in panel B are very close, indicating very similar activities. The arrows show the times for 50% and 100% lysis for tPA. The inset is a magnified view focusing on the initial rates of fibrinolysis in fibrin5.
Figure 2
Figure 2
Plasminogen activation rates over a range of tPA concentrations in the presence of fibrin formed at high and low thrombin concentrations. Clots were prepared using thrombin at 100nM fibrin100 (◇, solid line) or 10nM fibrin10 (○, dashed line) and subsequently tPA from 0.15 to 1.2nM overlaid in the presence of S-2251. Initial rates were measured up to an absorbance change of 0.1. Data are plotted as log dose tPA (nM added to the clot) versus log response (rate of change of absorbance/s2 × 109).
Figure 3
Figure 3
SEM images of fibrin clots formed using high and low thrombin concentrations before and during lysis using tPA. (A-B) The structure of fibrin5 and fibrin100 formed at 5 and 100nM thrombin, respectively. Insets are areas from panels A and B at higher magnification to show more detail of the fibrin fiber structure present in each clot. (C-D) The same kind of fibrin but after 10 minutes of lysis after the addition of tPA to the surface of the clot. (C) Characteristic fibrin aggregate structures in fibrin5 that are not formed in fibrin100.
Figure 4
Figure 4
Confocal microscopy showing a time course of lysis of fibrin clots formed using high and low thrombin concentrations in the presence of tPA-GFP. (A) The pattern of tPA binding and fibrin lysis as the fibrin front recedes for fibrin formed using 5nM thrombin (fibrin5). (B) The same time course for fibrin formed at 100nM thrombin (fibrin100). Images were taken at the indicated time after the addition of tPA-GFP, and the green channel components of the sequential frames were overlaid in a single image for presentation purposes. A characteristic granular pattern of fluorescence can be seen at the lysis front in fibrin5, whereas in fibrin100 the tPA-GFP is distributed more homogeneously.
Figure 5
Figure 5
Colocalization of tPA-GFP with fibrin protein aggregates. Orange-labeled fibrinogen was clotted with thrombin at 5nM (A-C, fibrin5) or 100nM (D-F, fibrin100) and fibrinolysis initiated with the addition of tPA-GFP. After 35 minutes of lysis, micrographs were taken of green fluorescence (A,D) and red fluorescence (B,E). (C,F) Overlays of the corresponding single fluorescent micrographs for each fibrin type. Fibrin5 shows the granular pattern of fibrin aggregates noted previously, which can be seen to bind tPA. (C) Overlay also shows a number of green particles of precipitated tPA-GFP. Fibrin100 displays a narrow zone of bound tPA and few fibrin aggregates.
Figure 6
Figure 6
Progress of fibrinolysis in fibrin5 formed using 5nM thrombin with delF-tPA-GFP. The 4 panels are snapshots of the distribution of delF-tPA-GFP during fibrinolysis at the times indicated in the upper corner. Initial binding and concentration of the delF-tPA-GFP to the surface of the clot were slow, but after 10 minutes a narrow zone of concentrated activator formed. Subsequently, some tPA diffused ahead of the fibrin-buffer interface and was associated with some fibrin aggregates; a proportion of delF-tPA-GFP also remained close to the fibrin-buffer interface appearing as a “starburst” pattern.

References

    1. Weisel JW, Litvinov RI. The biochemical and physical process of fibrinolysis and effects of clot structure and stability on the lysis rate. Cardiovasc Hematol Agents Med Chem. 2008;6(3):161–180. - PubMed
    1. Carr ME, Jr, Alving BM. Effect of fibrin structure on plasmin-mediated dissolution of plasma clots. Blood Coagul Fibrinolysis. 1995;6(6):567–573. - PubMed
    1. Gabriel DA, Muga K, Boothroyd EM. The effect of fibrin structure on fibrinolysis. J Biol Chem. 1992;267(34):24259–24263. - PubMed
    1. Collet JP, Park D, Lesty C, et al. Influence of fibrin network conformation and fibrin fiber diameter on fibrinolysis speed: dynamic and structural approaches by confocal microscopy. Arterioscler Thromb Vasc Biol. 2000;20(5):1354–1361. - PubMed
    1. Kolev K, Tenekedjiev K, Komorowicz E, Machovich R. Functional evaluation of the structural features of proteases and their substrate in fibrin surface degradation. J Biol Chem. 1997;272(21):13666–13675. - PubMed

Publication types