

doi: 10.1038/nmeth.1530.
Epub 2010 Oct 21.
Chronic optical access through a polished and reinforced thinned skull
Affiliations
- PMID: 20966916
- PMCID: PMC3204312
- DOI: 10.1038/nmeth.1530
Item in Clipboard
Chronic optical access through a polished and reinforced thinned skull
Nat Methods.
2010 Dec.
Abstract
We present a method to form an optical window in the mouse skull that spans millimeters and is stable for months without causing brain inflammation. This enabled us to repeatedly image blood flow in cortical capillaries of awake mice and determine long-range correlations in speed. We also repeatedly imaged dendritic spines, microglia and angioarchitecture, as well as used illumination to drive motor output via optogenetics and induce microstrokes via photosensitizers.
Conflict of interest statement
The authors declare no competing financial interests.
Figures
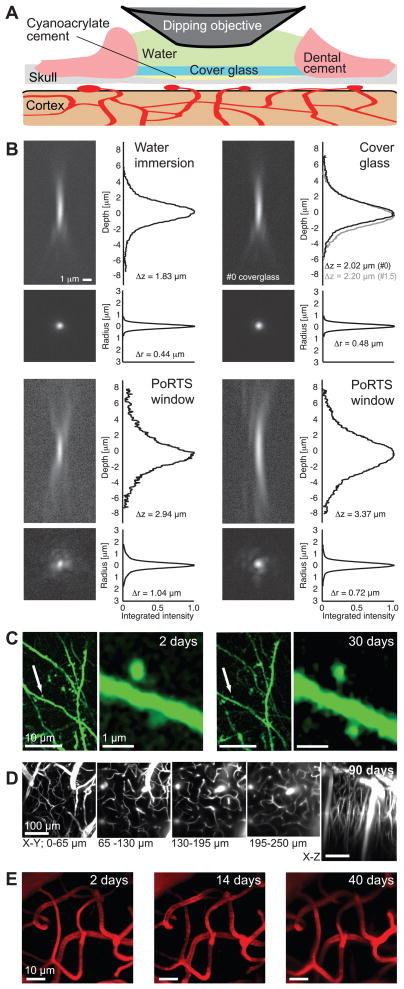
(A) Schematic of the window. The thinned and polished skull is protected with a cover glass attached with cyanoacrylate cement. Dental cement is used to seal the edge of the cover glass and provide support for the meniscus. The thinned area is typically 1 – 2 mm on edge. (B) Point spread functions for TPLSM determined by imaging 0.2 μm fluorescent beads were embedded in 1 % (w/v) agarose and imaged with a 40x, 0.8 NA water dipping objective. The axial depth profile shown the integrated radial intensity along the optical axis, i.e., z-axis, and the radial depth profile shows the integrated axial intensity along the radial axis. The reported Δz and Δr are the full widths that encompass half of the integrated intensity. The top left panel shows a bead imaged through only water along width depth profiles. The top right panel shows a bead imaged under a #0 cover glass (black line) along with depth profiles, along with the profiles for a #1.5 cover glass (grey line). The two bottom panels show separate examples of beads imaged through an excised PoRTS window. (C) Dendrites and spines of thy1-YFP expressing neurons two days (left panel) and 30 days (right panel) after PoRTS window implantation. Images were taken 30 μm below the surface. Reduction in the brightness of the YFP over time necessitated averaging of five frames for images taken one month after implantation; the dwell time was 6 μs per pixel and the average incident power was 35 – 70 mW. Representative image from a set of two mice (D) Maximum z-axis projections across 65 μm of fluorescein-conjugated-dextran filled vasculature through a PoRTS window 90 days after surgery. Each image is the average of six frames, the z-step was 2 μm, the dwell time was 3 μs per pixel and the average power was 25 – 120 mW. Representative images from a pool of 35 mice (E) Subsurface microvessels are stable under the PoRTS window for over a month after implantation. Images show maximum projections across 20 – 70 μm below the surface using an average of 5 frames, a dwell time of 6 μs per pixel, and an average power of 30 – 45 mW. Representative images from a set of two mice.
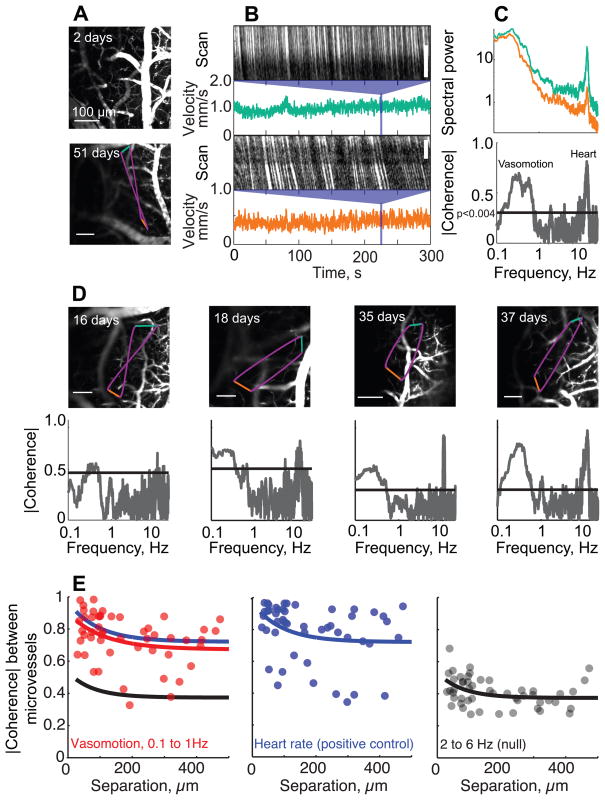
Example data in panels A to D are taken from the same animal using a 10x,0.3 NA lens and averaging over 5 – 10 frames (A) Top panel is the maximal z projection over 90 μm of images of fluorescein-conjugated-dextran labeled vasculature, based on frames separated by 10 μm, two days after surgery. Bottom panel is an image from a single plane in the same animal, but a different location, 51 days after surgery. The colored lines show the scan path of the laser focus: green and orange are constant velocity segments along capillaries and purple are minimum time segments between capillaries. (B) Space-time plots of one segment of line scan data for each of two capillaries, with the calculated instantaneous velocity for the entire 300 s run shown below. (C) Top panel shows power spectra for the two velocity traces in panel B; 0.083 Hz bandwidth. A rhythmic component at ~ 10 Hz results from the heartbeat. Bottom panel is the magnitude of the spectral coherence between the velocities of the two capillaries as a function of frequency; 0.1 Hz bandwidth. Line denotes a significance of p < 0.004, which corresponds to the inverse of twice the number of degrees of freedom. Note the strong coherence at the heart rate and at the 0.1 – 1 Hz vasomotor frequencies. (D) Examples of spontaneous velocity coherences between capillaries obtained various times after surgery; 0.1 Hz bandwidth. Panels A-D show representative data from a pool of 17 animals monitored up to 60 days after implantation (E) The coherence as a function of distance (50 vessel pairs in 9 mice). Left panel is the mean coherence in the 0.1 – 1.0 Hz vasomotor band. Center panel is the coherence at the heart-rate, which serves as a positive control for the maximum possible coherence. Right panel is the coherence in the 2 to 6Hz band, which serves as the null hypothesis. Colored lines correspond to fits with exponential functions to the corresponding spectral band.
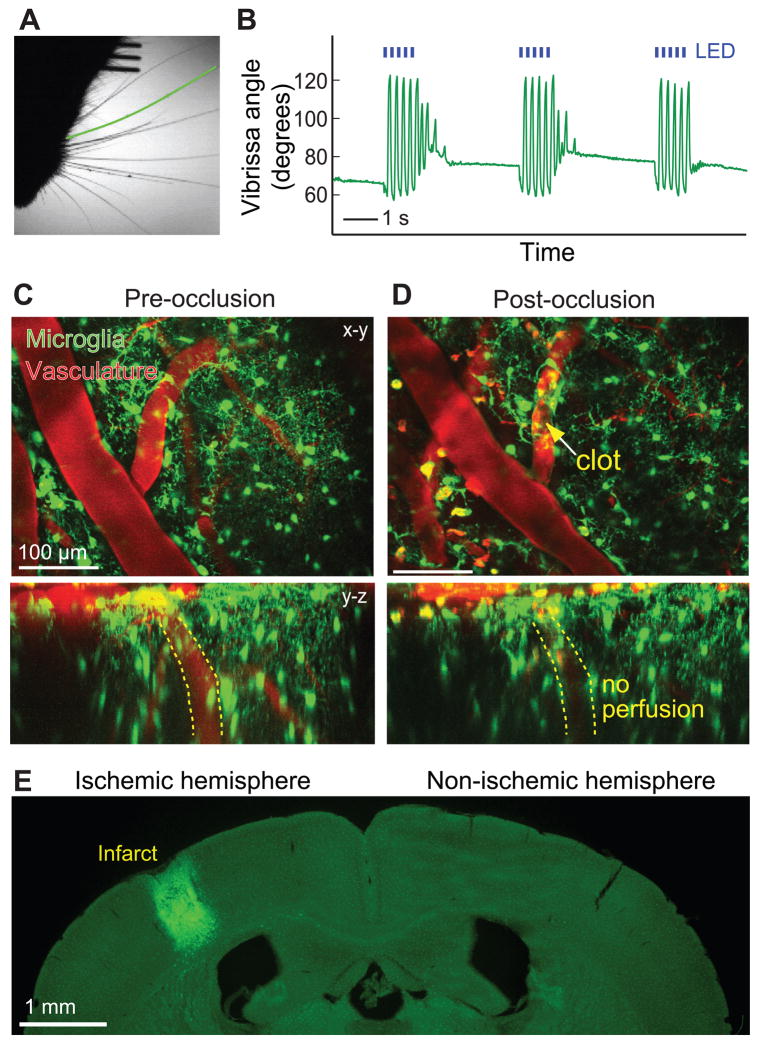
(A) Sample frame from video of awake, head-fixed ChR2 carrying mouse with a PoRTS window fabricated over vibrissa motor cortex 150 days earlier. Green line marks the position of the caudal vibrissa that is tracked over time. (B) Rostral-caudal motion of a caudal vibrissa in response to pulses of 467 nm light (5 Hz, 100 ms pulse duration; blue lines) from a light emitting diode (LED). Larger angles indicate retraction. A-B representative data from a set of two animals. (C and D) Maximal projection (x-y and y-z) through a 200 μm depth of a Cx3cr1eGFP+/− mouse cortex before (panel C) and 100 minutes after (panel D) occlusion of a single penetrating arteriole using targeted optical activation of Rose Bengal (yellow arrow points to clot). Images are averages of four frames with a dwell time of 3 μs per pixel and 1 μm steps along the z-axis. Note the change in microglia morphology to an amoeboid shape around the occluded arteriole and the interruption of flow as evidenced by the absence of Texas Red in the penetrating vessel highlighted in the y – z projection in the bottom pannels. The occlusion was made one day after implantation of the window. (E) The extent of the infarct, for the same animal as in panels C and D, visualized two days after the optically generated stroke. Note the invasion of eGFP labeled microglia into the cyst. The data in panels C to E are representative images from a set of two mice.
References
-
- Svoboda K, Denk W, Kleinfeld D, Tank DW. Nature. 1997;385:161. - PubMed
-
- Levasseur JE, Wei EP, Raper AJ, Kontos AA, Patterson JL. Stroke. 1975;6:308. - PubMed
-
- Grutzendler J, Kasthuri N, Gan WB. Nature. 2002;420:812. - PubMed
-
- Trachtenberg JT, Chen BE, Knott GW, Feng G, Sanes JR, Welker E, Svoboda K. Nature. 2002;420:788. - PubMed
Publication types
MeSH terms
Substances
Grants and funding
- RR021907/RR/NCRR NIH HHS/United States
- R01 NS066361/NS/NINDS NIH HHS/United States
- R01 EB003832/EB/NIBIB NIH HHS/United States
- R01 NS052189/NS/NINDS NIH HHS/United States
- DP1 NS082097/NS/NINDS NIH HHS/United States
- NS066361/NS/NINDS NIH HHS/United States
- MH085499/MH/NIMH NIH HHS/United States
- R01 MH085499/MH/NIMH NIH HHS/United States
- R21 RR021907/RR/NCRR NIH HHS/United States
- NS059832/NS/NINDS NIH HHS/United States
- DP1 OD006831/OD/NIH HHS/United States
- EB003832/EB/NIBIB NIH HHS/United States
- R21 NS059832/NS/NINDS NIH HHS/United States
LinkOut - more resources
Full Text Sources
Other Literature Sources
