. 2010 Oct 12;8(10):e1000513.
doi: 10.1371/journal.pbio.1000513.

Emergence of noise-induced oscillations in the central circadian pacemaker

Affiliations

Emergence of noise-induced oscillations in the central circadian pacemaker

Caroline H Ko et al. PLoS Biol. .

Erratum in

  • PLoS Biol. 2010;8(10) doi: 10.1371/annotation/45e0bb8b-69bd-4ba0-bb9e-6641bce10fc6.

Abstract

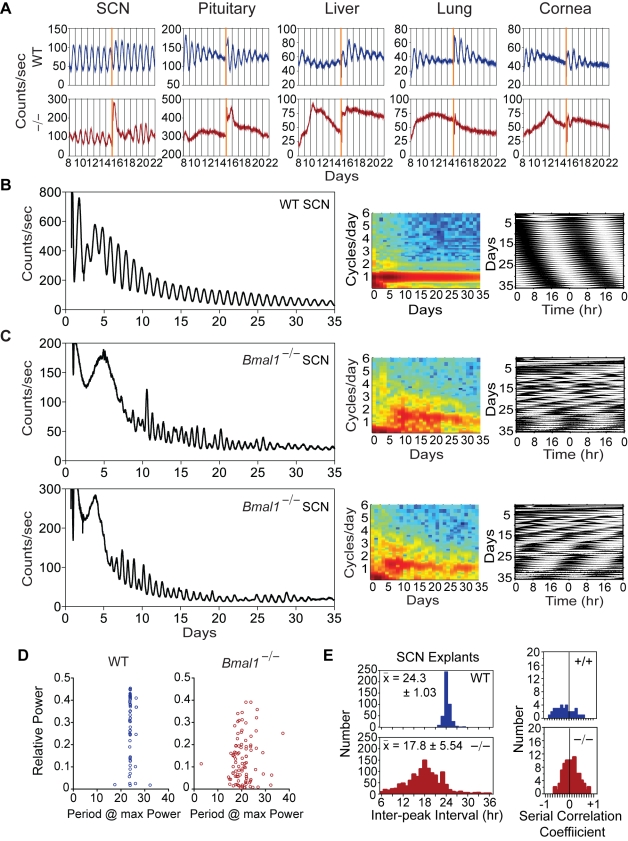
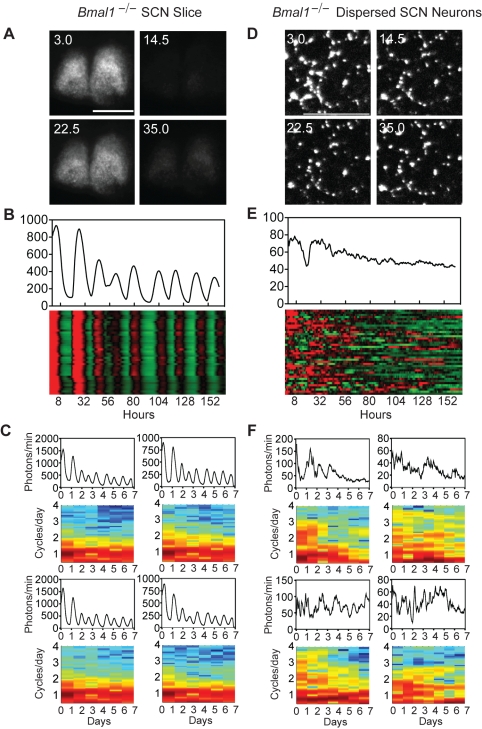
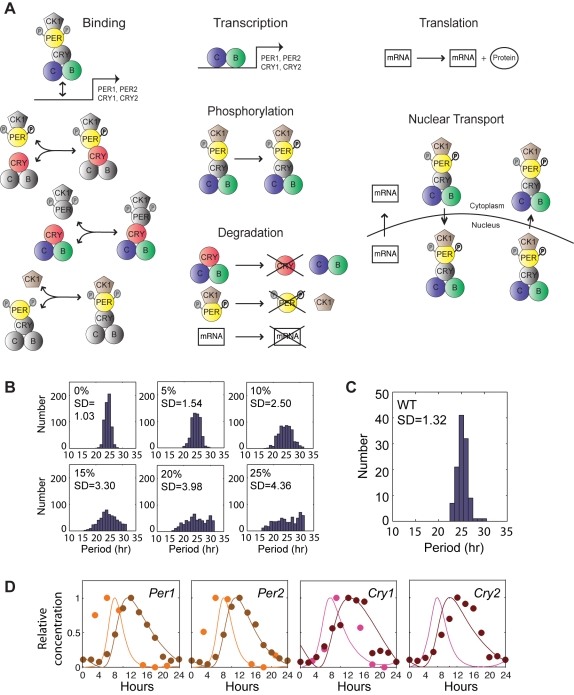
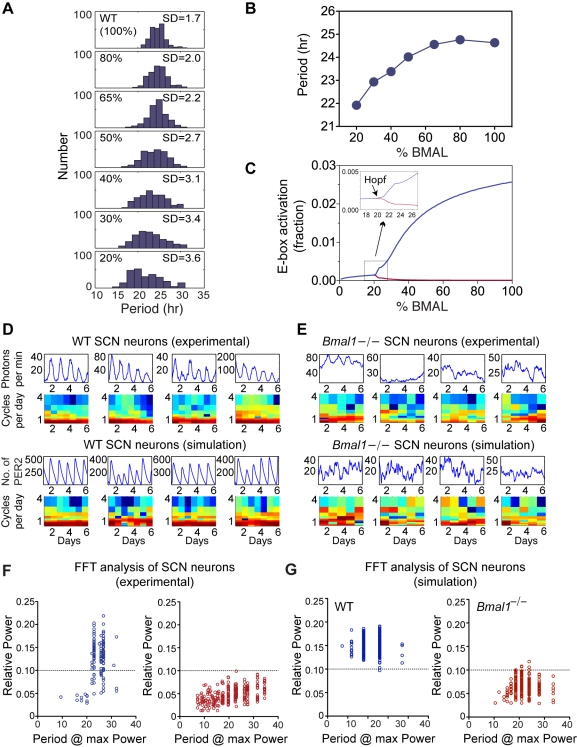
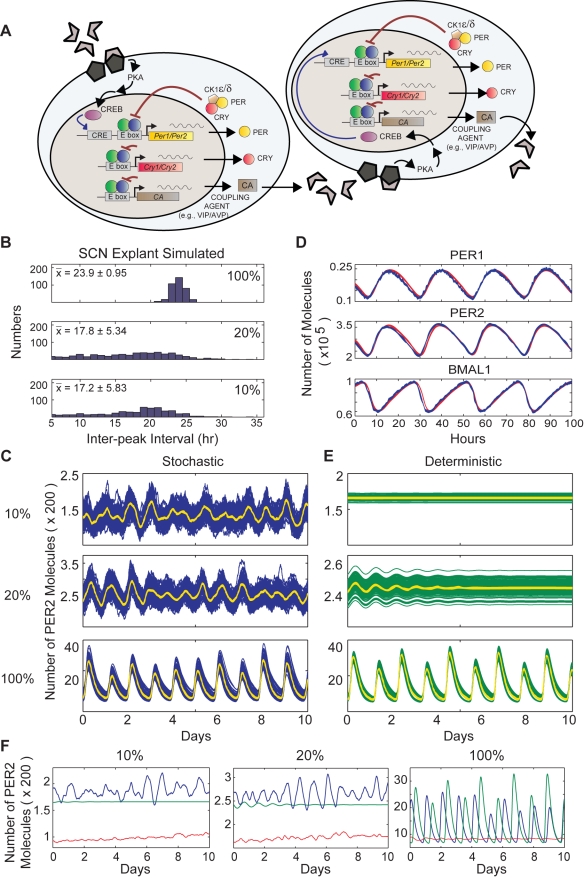
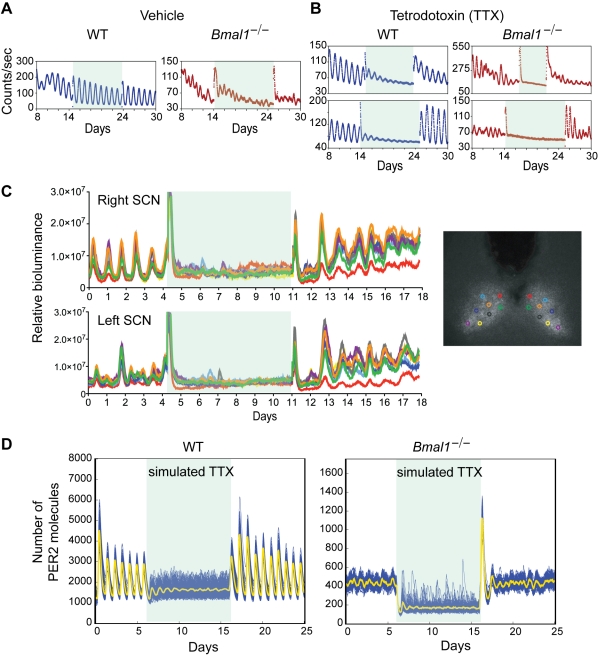
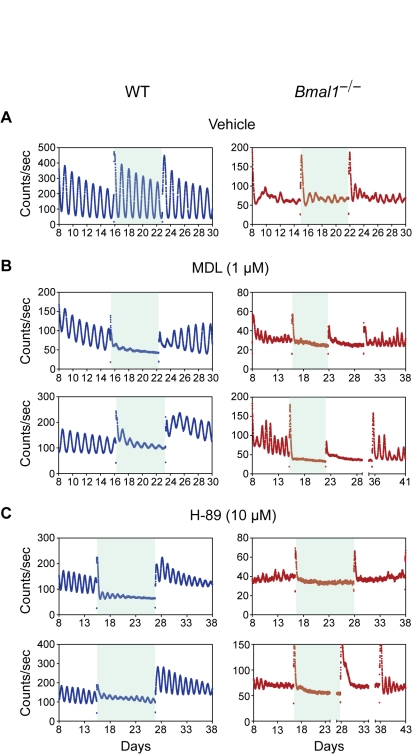
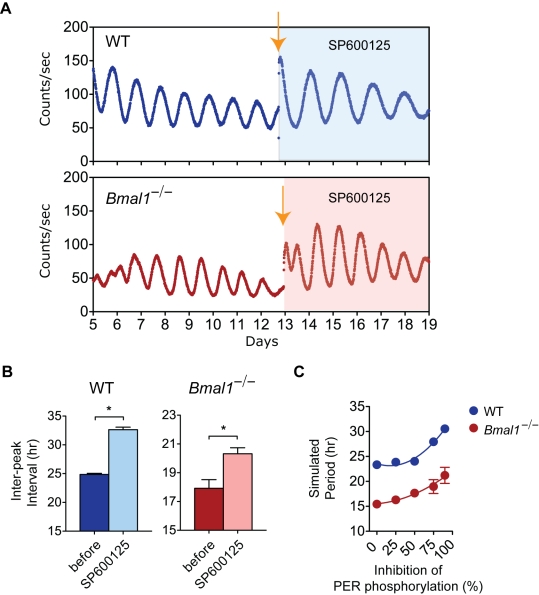
Bmal1 is an essential transcriptional activator within the mammalian circadian clock. We report here that the suprachiasmatic nucleus (SCN) of Bmal1-null mutant mice, unexpectedly, generates stochastic oscillations with periods that overlap the circadian range. Dissociated SCN neurons expressed fluctuating levels of PER2 detected by bioluminescence imaging but could not generate circadian oscillations intrinsically. Inhibition of intercellular communication or cyclic-AMP signaling in SCN slices, which provide a positive feed-forward signal to drive the intracellular negative feedback loop, abolished the stochastic oscillations. Propagation of this feed-forward signal between SCN neurons then promotes quasi-circadian oscillations that arise as an emergent property of the SCN network. Experimental analysis and mathematical modeling argue that both intercellular coupling and molecular noise are required for the stochastic rhythms, providing a novel biological example of noise-induced oscillations. The emergence of stochastic circadian oscillations from the SCN network in the absence of cell-autonomous circadian oscillatory function highlights a previously unrecognized level of circadian organization.


Conflict of interest statement

The authors have declared that no competing interests exist.

Figures

Figure 1
Figure 1. Effects of Bmal1 mutation on PER2::LUC bioluminescence rhythms.
(A) Representative records of PER2::LUC bioluminescence from various tissue explants from wild type (WT) and homozygous Bmal1-null mutant (−/−) mice. Mice were kept in a light-dark cycle (12 h light, 12 h dark) for approximately 2 wk, then released into constant darkness. The tissue explants were dissected (day 0) and immediately cultured for recording. Data are shown following a medium change (day 8); another medium change occurred at day 15. (B and C) Detailed view of PER2::LUC bioluminescence from SCN explants of WT (B) and Bmal1 −/− mice (C). Records begin on the day of culture (day 0) and are “raw” LumiCycle bioluminescence recordings that are not normalized nor corrected for baseline drift. All SCN explants show persistent PER2::LUC rhythms for >35 d (left). FFT spectrograms of the baseline-subtracted records (middle) show a tightly regulated frequency (cycles per day) for the WT SCN; however, more variable frequency components are observed in the Bmal1 −/− SCN. Double-plotted raster plots (right) illustrate stable PER2::LUC rhythms in the WT SCN and instability of the rhythms in Bmal1 −/− SCN. (D) FFT spectral analysis for PER2::LUC rhythms from SCN explants. Period values with the maximum spectral power were determined for WT and Bmal1 −/− SCN explants using FFT spectral analysis (see Methods under Single-Cell Imaging Data Analysis). Each data point represents the maximum frequency component in a 10-d epoch of data. Bmal1 −/− SCN explants showed high variability in period length (average = 20.51±4.39 SD h) compared to WT SCN explants (average period = 24.16±0.83 SD h). (E) Histograms of inter-peak intervals for the PER2::LUC rhythmic expression patterns (left) and serial correlation coefficient (rs, right) of successive inter-peak intervals. The Bmal1 −/− SCN explants show a significantly shorter average inter-peak interval and a much broader distribution compared to WT SCNs. Histograms represent 433 inter-peak intervals from 23 WT SCN explants and 1,239 intervals from 19 Bmal1 −/− SCN explants. rs estimates were calculated from successive 7 to 10 inter-peak interval epochs. Histograms represent 36 rs estimates from 14 WT SCN explants and 85 rs estimates from 16 Bmal1 −/− SCN explants. The average serial correlation coefficient for WT SCN explants was negative (rs = −0.17, p<0.01) as would be expected from a circadian pacemaker-driven process. However, the coefficient for the Bmal1 −/− SCN was slightly positive (rs = 0.07, p<0.05).
Figure 2
Figure 2. Stochastic rhythmicity in Bmal1 −/− SCN is not cell autonomous.
(A) Bioluminescence images of a Bmal1 −/− SCN explant culture at peak and trough phases. Numbers indicate hours after start of imaging. Scale bar = 500 µm. Imaging experiments were initiated after 2–3 wk of culture. (B) Average bioluminescence and heatmap plots of bioluminescence intensity of individual Bmal1 −/− neurons in an intact organotypic SCN slice. Forty cells are presented, with each horizontal line representing a single cell. These cells show tightly synchronized stochastic rhythms that are comparable to rhythms seen with PMT luminometry. (C) PER2::LUC rhythms (top) and corresponding FFT Spectrograms (bottom) for first 4 cells shown in (B) (i.e., coupled in Bmal1 −/− SCN explant). (D) Bioluminescence images of dissociated individual Bmal1 −/− SCN neurons showing nonrhythmic bioluminescence patterns. Numbers and scale bar are as in (A). (E) Average bioluminescence and heatmap plots of bioluminescence intensity of 40 individual Bmal1 −/− neurons in dispersed culture imaged in (D), showing a lack of co-ordinated rhythmicity. (F) PER2::LUC rhythms (top) and corresponding FFT spectrograms (bottom) for first 4 cells shown in (E) (i.e., dispersed Bmal1 −/− SCN cells).
Figure 3
Figure 3. Illustration of the elements of the stochastic model of the cellular circadian clock and heterogeneity in period length.
(A) The biochemical processes modeled in an SCN cell. The specific equations and rates are included in Figure S7 (see also Protocol S1). Gray components represent molecules that could be bound but have no effect on the indicated process. This model is based on the Forger-Peskin model but contains three major improvements: (1) it allows for binding and unbinding of CLOCK:BMAL to Per1, Per2, Cry1, and Cry2 genes; (2) it allows interaction of CLOCK:BMAL with CRY1 or CRY2; and (3) it uses updated rates of degradation of mRNAs and proteins measured empirically by Siepka et al. . (B) Histograms of average period length of 250 simulated single cells when the variation in biochemical parameters is within 0%, 5%, 10%, 15%, 20%, or 25% of the mean values of the rate constants. (C) Histogram of single-cell periods experimentally measured from dissociated WT SCN cells. The mean and standard deviation values from this experiment were used to select the best match of mean and standard deviation for the simulated cells; the simulated values were comparable to experimental values at 5% variation in rate constants. (D) Representative traces of relative concentration of Cry1/2 and Per1/2 mRNA and protein. Circles indicate experimental data from Lee et al. , and lines are stochastic simulations of a population of 100 cells using the model summarized in Figure 5A. Orange and pink traces represent mRNA levels (mRNA values for Cry2 were not reported in the original data). Brown and red traces represent protein levels.
Figure 4
Figure 4. Effects of BMAL activator level on circadian oscillations in a stochastic model of isolated cellular oscillators.
(A) Histograms of simulated isolated cell mean period lengths at various percentages of total WT BMAL. These results show that as the percentage of total BMAL decreases, the mean period length decreases, along with an increase in the variance of the period. (B) The figure shows that as we go below certain percentage of total BMAL, rhythms in a population of uncoupled single cells disappear. This figure is an alternative way to observe bifurcations by plotting the period from a population of single un-coupled cells as a function of total BMAL. Below ∼20% of total BMAL, rhythms disappear in single cells, indicating a Hopf bifurcation at this point. (C) The bifurcation diagram of a single oscillator as a function of total BMAL using a deterministic model. The y-axis plots the value G, which mathematically represents the fraction of time an E-box is activated. This was chosen since this variable affects basically all parts of the model (in particular PER1, PER2 CRY1, CRY2, all their relevant complexes, and the coupling factor). In theory, any possible variable could be used for the bifurcation diagram and the same behavior (i.e., a Hopf bifurcation) would be observed. Plotted on this diagram are the minimum and maximum (red and blue, respectively) values from the oscillation of G at a particular value of total BMAL—100% BMAL corresponds to WT BMAL. When these values are equal, the system is at rest and no oscillations are present; however, as these values begin to diverge, oscillations are observed. At approximately 22% of total BMAL, we begin to observe oscillations, indicating that a Hopf bifurcation exists at this point (see inset). Therefore, single cells show no sustained rhythmic behavior below ∼22% of total BMAL. (D) Representative traces of PER2::LUC bioluminescence measured experimentally in WT isolated SCN neurons and their respective FFT spectrograms are shown in the top row. Representative traces of WT simulated isolated cells and their respective FFT spectrograms are shown in the bottom row. (E) Representative traces and their respective FFT spectrograms of Bmal1 −/− experimental (first two rows) and simulated isolated cells (bottom rows). These results show a loss of circadian rhythms in single Bmal1 −/− SCN cells in both experimental and simulated isolated cells. (F) FFT spectral analysis for PER2::LUC rhythms recorded from dissociated SCN neurons. A cell was considered to show significant circadian periodicity when spectral analysis indicated a peak in the circadian range (20–36 h) large enough such that a 0.14 cycles/day window centered on the peak accounted for at least 10% of the total variance in the record (FFT power spectrum, Blackman-Harris windowing, peak amplitude ≥0.1) as described previously . All (243 of 243) Bmal1 −/− cells were equal to or below a 0.1 cutoff value for circadian rhythmicity (indicated by the dotted line), whereas approximately 80% of WT neurons were above this cutoff value and displayed circadian rhythmicity. (G) FFT spectral analysis on simulated PER2::LUC rhythms from isolated SCN neurons. A cell was considered to show significant circadian periodicity using the same criterion as in (F). All but two (248 of 250) WT cells were above the 0.1 cutoff value (indicated by the dotted line) for circadian rhythmicity. Only 5 of 250 simulated Bmal1 −/− neurons were equal to or above this cutoff value.
Figure 5
Figure 5. Modeling of intercellular coupling mechanisms in a population of simulated SCN cells.
(A) Computational simulations applying coupling mechanisms to a population of 100 cells. The CLOCK:BMAL complex activates production of coupling agents (CA; e.g., VIP). CAs are secreted and act on cell-surface receptors on other SCN neurons, triggering cell-signaling pathways. The final product of the receptor pathways, CREB, binds to a CRE element upstream of PER. In the proposed mechanism, CREB forms a dimer and binds to a CRE element, which leads to activation of PER. CRY can repress CREB-activated PER production. (B) Histograms of average inter-peak intervals in a simulated population of coupled cells with 100%, 20%, and 10% of total WT BMAL. These results show that as the amount of BMAL is decreased, the average period decreases and the variance in the period length increases. Calculations were done as in Figure 1E. (C) The output of PER2 protein from stochastic simulations with 10%, 20%, and WT (100%) amounts of BMAL. The population averages from each simulation are plotted in yellow. (D) The proposed model was simulated for a single cell using both stochastic and deterministic approaches. In the limit of a large number of molecules, the results of the stochastic simulations (blue) agreed with the deterministic simulations (red) when the same parameter values were used. Shown in this figure are concentrations of total PER1, total PER2, and free BMAL1 proteins. Results would be similar for any other protein complex or mRNA in the proposed model. (E) The output of PER2 protein from deterministic simulations of a coupled population of oscillators with 10%, 20%, and WT (100%) amounts of BMAL. The population averages from each simulation are plotted in yellow. Contrary to the stochastic simulation (as shown above in 5C), the deterministic simulation could not sustain rhythmicity by coupling alone. (F) The average PER2 out from a simulated population of 100 cells. The left panel is the mean population rhythm of noisy coupled cells (stochastic; blue), coupled deterministic cells (green), and noisy uncoupled cells (red) at 10% of total WT BMAL. The middle and right panels are the same as the left panel, except that the cells are at 20% and 100% of total WT BMAL, respectively. These results indicate that neither noise alone nor coupling alone is sufficient to produce rhythms in a population of BMAL1-deficient cells. In addition, it is evident that coupling elevates the average number of PER molecules.
Figure 6
Figure 6. Uncoupling SCN cells abolishes stochastic rhythms from Bmal1 −/− SCN explants.
(A and B) Representative records of PER2::LUC rhythms of the SCN explants from WT (blue) and Bmal1 −/− (red) mice. Data are shown following a medium change (day 8); shaded area indicates when SCN explants were changed to fresh medium containing vehicle solution (A) or tetrodotoxin (B). (C) Single-cell rhythmicity before, during, and after TTX treatment from cells within an intact Bmal1 −/− SCN slice. On the right is a PER2::LUC bioluminescence image of the Bmal1 −/− SCN explant showing color-coded locations of the analyzed cells. Uncoupling cells by TTX treatment within an intact organotypic SCN slice results in arrhythmic single-cells with average PER2::LUC level similar to that of SCN neurons in dispersed culture (see Figure 2F). Records of individual Bmal1 −/− and WT cells are shown in Figure S5. (D) WT and Bmal1 −/− SCN networks are simulated with normal coupling, with coupling reduced to 0% of its original value (simulating the effect of TTX), and with coupling slowly restored (with a time constant of 2 h).
Figure 7
Figure 7. Inhibition of cAMP signaling abolishes stochastic rhythms from Bmal1 −/− SCN explants.
(A–C) Representative records of PER2::LUC rhythms of the SCN explants from WT (blue) and Bmal1 −/− (red) mice. Data are shown following a medium change (day 8); shaded area indicates when SCN explants were chronically treated with vehicle solution (A), 1 µM MDL (B), or 10 µM H-89 (C). WT SCN explants recovered rhythms immediately following the washout of MDL (B, left) or H-89 (C, left); however, almost all Bmal1 −/− explants required second washout to reinitiate their rhythms (B and C; right).
Figure 8
Figure 8. Effects of SP600125 on periodicity in WT and Bmal1 −/− SCN explants.
(A) Representative records of PER2::LUC rhythms from SCN explants of WT (top) and Bmal1 −/− (bottom) mice. Shown are 8 d of bioluminescence record before SP600125 treatment followed by 6 d of bioluminescence record during the SP600125 (25 µM) treatment (shaded). At the time indicated by orange arrow, individual SCN explants were changed into a fresh medium with the kinase inhibitor. (B) Average inter-peak intervals of PER2::LUC rhythms (±SEM) of WT (left; before = 24.86±0.19 h, SP600125 = 32.65±0.43 h) and Bmal1−/− (right; before = 17.92±0.60 h, SP600125 = 20.32±0.42 h) SCN explants. SP600125 treatment lengthened the intervals in both WT (paired t-test, p<0.0001, df = 5) and Bmal1−/− (paired t-test, p<0.0005, df = 6) SCN explants. (C) Average period (±SEM; n = 6 per data point) from simulated WT (blue) and Bmal1 −/− (red) SCN networks with varying percent inhibition of PER phosphorylation by CK1. The error bars (±SEM) cannot be seen in some of the data plots because the symbol is larger than the bar. Period values of WT and Bmal1 −/− SCN networks were significantly different from each other and as a function of inhibition of PER phosphorylation (two-way ANOVA, p<0.001).

References

    1. Welsh D. K, Logothetis D. E, Meister M, Reppert S. M. Individual neurons dissociated from rat suprachiasmatic nucleus express independently phased circadian firing rhythms. Neuron. 1995;14:697–706. - PubMed
    1. Nagoshi E, Saini C, Bauer C, Laroche T, Naef F, et al. Circadian gene expression in individual fibroblasts: cell-autonomous and self-sustained oscillators pass time to daughter cells. Cell. 2004;119:693–705. - PubMed
    1. Welsh D. K, Yoo S. H, Liu A. C, Takahashi J. S, Kay S. A. Bioluminescence imaging of individual fibroblasts reveals persistent, independently phased circadian rhythms of clock gene expression. Curr Biol. 2004;14:2289–2295. - PMC - PubMed
    1. Yoo S. H, Yamazaki S, Lowrey P. L, Shimomura K, Ko C. H, et al. PERIOD2::LUCIFERASE real-time reporting of circadian dynamics reveals persistent circadian oscillations in mouse peripheral tissues. Proc Natl Acad Sci U S A. 2004;101:5339–5346. - PMC - PubMed
    1. Lowrey P. L, Takahashi J. S. Mammalian circadian biology: elucidating genome-wide levels of temporal organization. Annu Rev Genomics Hum Genet. 2004;5:407–441. - PMC - PubMed

Publication types

MeSH terms