. 2011 Sep;10(3):334-50.
doi: 10.1007/s12311-010-0221-6.

Cerebellar zones: a personal history

Affiliations

Cerebellar zones: a personal history

Jan Voogd. Cerebellum. 2011 Sep.

Abstract

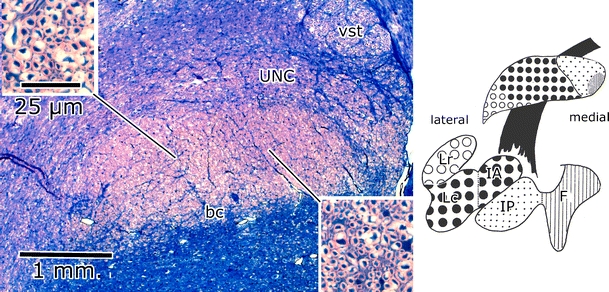
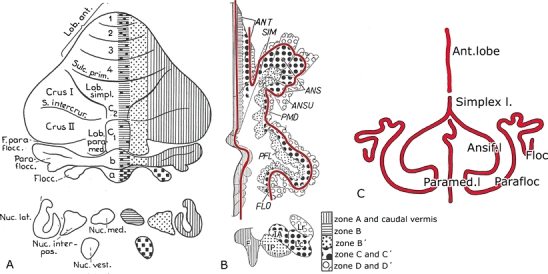
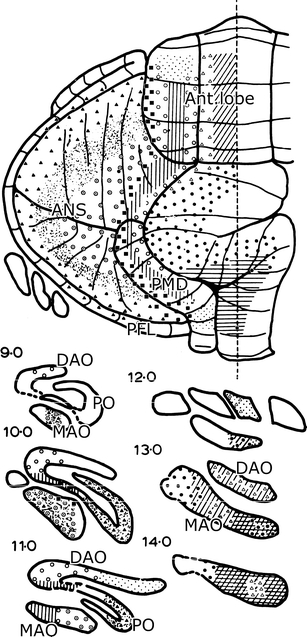
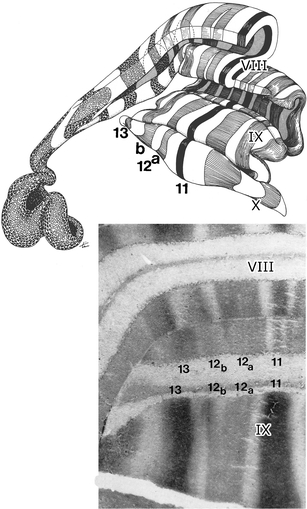
Cerebellar zones were there, of course, before anyone noticed them. Their history is that of young people, unhindered by preconceived ideas, who followed up their observations with available or new techniques. In the 1960s of the last century, the circumstances were fortunate because three groups, in Leiden, Lund, and Bristol, using different approaches, stumbled on the same zonal pattern in the cerebellum of the cat. In Leiden, the Häggqvist myelin stain divulged the compartments in the cerebellar white matter that channel the afferent and efferent connections of the zones. In Lund, the spino-olivocerebellar pathways activated from individual spinal funiculi revealed the zonal pattern. In Bristol, charting the axon reflex of olivocerebellar climbing fibers on the surface of the cerebellum resulted in a very similar zonal map. The history of the zones is one of accidents and purposeful pursuit. The technicians, librarians, animal caretakers, students, secretaries, and medical illustrators who made it possible remain unnamed, but their contributions certainly should be acknowledged.


Figures

Fig. 1
Fig. 1
Professor W.J.C. Verhaart 1889–1983
Fig. 2
Fig. 2
The brachium conjunctivum of the cat. Häggqvist stain. The diagram on the right shows the origin of its medial one third from the posterior interposed (IP) and fastigial (F) nuclei. The coarse fibers of its middle third take their origin from the anterior interposed nucleus (IA) and the dorsal part of the lateral nucleus (Lc), its lateral pole from the ventral part of the lateral nucleus (Lr) [19]. bc brachium conjunctivum, unc uncinate tract, vst ventral spinocerebellar tract
Fig. 3
Fig. 3
Prof. Jan B. Jansen (1898–1984) and Prof. Alf Brodal (1910–1988). Courtesy of Per Brodal
Fig. 4
Fig. 4
A Diagram of the corticonuclear projection of the cerebellum, showing the vermal, intermediate, and lateral zones of Jansen and Brodal [15]. Nomenclature of the lobules according to Bolk [20]. B Diagram of the flattened cerebellar cortex of the cat showing the corticonuclear projection. From Voogd [19]. The contoures (red) lines indicate the direction of the folial chains of vermis and hemisphere. C Stick diagram of the folial chains of the mammalian cerebellum. Bolk [20]. ANS(if.) ansiform lobule, ANSU ansula, ANT anterior lobe, F fastigial nucleus, FLOC flocculus, IA anterior interposed nucleus, IP posterior interposed nucleus, Lc dorsal part lateral nucleus, Lr ventral part lateral nucleus, PFL paraflocculus, PMD paramedian lobule, SIM lobulus simplex
Fig. 5
Fig. 5
Reconstruction of the white matter compartments of the anterior lobe of the ferret cerebellum. Compartment A with its target nucleus, the fastigial nucleus, is illustrated at the bottom of the figure
Fig. 6
Fig. 6
Borders of white matter compartments (“raphes”: arrowheads) at the midline, between A and B compartments, and between C1, C2, and C3 compartments. Purkinje cell axons of different compartments are illustrated at higher magnification in the lower right panels
Fig. 7
Fig. 7
a Diagram of the zebrin-positive and -negative Purkinje cell bands of the cerebellum of the mouse. Dorsal view. Zebrin-positive bands are identified by their numbers. Reproduced from Eisenman and Hawkes [73]. b Whole mount of L7-LacZ banding pattern in 11-day postnatal mouse, produced by manipulation of the promoter. Caudal view. Reproduced from Oberdick et al. [94]. c Distribution of Purkinje cells in mouse, born on E 11.5, shown at 20 days postnatally. Purkinje cells in empty strips are born either earlier or later. Reproduced from Hashimoto and Mikoshiba [92]
Fig. 8
Fig. 8
a Olivocerebellar projection shown in diagrams of the flattened cerebellar cortex and the flattened inferior olive of the cat. The method used to flatten the olive is shown in the bottom diagram. Reproduced from Brodal [34]. b Similar diagrams of the olivocerebellar projection in the cat from Groenewegen [36]. ANSl Ansiform lobule, B group beta, D dentate (lateral) nucleus, DAO dorsal accessory olive, dc dorsal cap, Dei lateral vestibular nucleus of Deiters, dl dorsal lamina principal olive, dmcc dorsomedial cell column, FLOC flocculus, IA anterior interposed nucleus, IP posterior interposed nucleus, l lateral, m medial, MAO medial accessory olive, PFLD dorsal paraflocculus, PFLV ventral paraflocculus, PMD paramedian lobule, PO principal olive, SI lobulus simplex, VI–X lobules VI–X of Larsell, vl ventral lamina principal olive, vlo ventrolateral outgrowth
Fig. 9
Fig. 9
Olov Oscarsson (1931–1996) with Lady Helena (left) and Sir John Eccles and his wife, Gerd Oscarsson, taken in Canberra in the 1960s. Courtesy of Gerd Oscarsson
Fig. 10
Fig. 10
Map of the anterior lobe of the cerebellum of the cat, showing the zonal projection of the dorsal funiculus spino-olivocerebellar climbing fiber path. The somatotopical organization of the zones is shown; indirect projections contain two or more synapses. The double nature of the C3 zone and the transverse branching of climbing fibers between the zones are indicated. Modified from [54]
Fig. 11
Fig. 11
Diagram of the zonal organization of the cerebellum of the rat. a Diagram of the flattened cerebellar cortex; the Purkinje cell zones are shown in the right half of the diagram. The A2 zone and the Y zone have not been identified in the monkey cerebellum. b Cerebellar and vestibular target nuclei of the Purkinje cell zones. c Diagram of the flattened inferior olive, showing subnuclei with projections to the Purkinje cell zones and their target nuclei. d Diagram of the zebrin-positive and -negative bands. A-D 2 Purkinje cell zones A-D2, 1–7 zebrin-positive bands P + 1–7, AI anterior interposed nucleus, Beta cell group beta, c caudal (MAO or DAO), C subnucleus C of the caudal MAO, DAO dorsal accessory olive, Dc caudal subnucleus of the dentate nucleus, DC dorsal cap and ventrolateral outgrowth, DLP dorsolateral protuberance of the fastigial nucleus, DMCC dorsomedial cell column, Dr rostral subnucleus of the dentate nucleus, F fastigial nucleus, i intermediate MAO, ICG interstitial cell groups, LV lateral vestibular nucleus, MAO medial accessory olive, PI posterior interposed nucleus, PO principal olive, r rostral (MAO or DAO), vest vestibular nuclei
Fig. 12
Fig. 12
Distribution of the axon reflex of branching climbing fibers in the cerebellum of the cat. Large symbols indicate stimulation sites; the axon reflex was recorded at the sites of the small symbols. Circles are sites located in the C1 and C3 zones; triangles are located in the C2 zone. Hatching indicates other interconnected sites. Reproduced from Armstrong et al. [63]
Fig. 13
Fig. 13
Diagram of the topographical localization in the olivocerebellar projection in the cat. Reproduced from Armstrong et al. [65]
Fig. 14
Fig. 14
Distribution of 5′-nucleotidase in lobules of the posterior lobe of the cerebellum in the mouse. Reproduced from Marani [69]. Drawing by Jan Tinkelenberg
Fig. 15
Fig. 15
Left panel the C2 and the floccular compartments 1–3 in the white matter of the floccular lobe of the rhesus monkey. Acetylcholinesterase staining. Right panel localization of labeled climbing fibers in floccular compartment 2, after an injection of tritiated leucine in the dorsal cap of the rhesus monkey. Reproduced from Gerrits [110]
Fig. 16
Fig. 16
Styropor reconstructions of the anterior aspect of the cerebellar anlage of three rhesus monkey fetuses, showing the emergence of the B, C1, and C3 Purkinje cell clusters between the early arriving A, C2, and D clusters. From Kappel [94]
Fig. 17
Fig. 17
Diagrams of the zones f1–f4 and C2 of the flocculus of the rabbit, their white matter compartments FC 1–4 and C2, their climbing fiber afferents (upper panel), their efferent connections (middle panel), and the rotation axes of the eyes on stimulation of compartments FC 1–3 (lower panel). dc dorsal cap, fm ventral folium of the flocculus, fp folium P of the ventral paraflocculus, MAO medial accessory olive, MV medial vestibular nucleus, SV superior vestibular nucleus, vlo ventrolateral outgrowth, Y group Y. Reproduced from Tan et al. and Van Der Steen et al. [–107]

Similar articles

Cited by

References

    1. Alzheimer A. Beiträge zur Kenntnis der pathologischen Glia und ihrer Beziehungen zu den Abbauprodukten im Nervengewebe. Histologische und histopathologische Arbeiten über die Grosshirnrinde, vol. 3. 1910. p. 3.
    1. Romeis B. Mikroskipische Technik. München: Ildenburg; 1948.
    1. Blum F. Der Formaldehyd als Härtungsmittel. Zeitschrift für wissneschaftliche Mikroskopie. 1896;10:314.
    1. Häggqvist Analyse der Faserverteilung in einem Rückenmarkquerschnitt. Z Mikr Anat Forschung. 1936;39:1–34.
    1. Mechelse K. De vezelstructuur van de capsula interna en pedunculus cerebri bij Macaca ira. Thesis, Leiden; 1953.

LinkOut - more resources