. 2011 Jan;53(1):106-15.
doi: 10.1002/hep.23998. Epub 2010 Oct 21.

Osteopontin is induced by hedgehog pathway activation and promotes fibrosis progression in nonalcoholic steatohepatitis

Affiliations

Osteopontin is induced by hedgehog pathway activation and promotes fibrosis progression in nonalcoholic steatohepatitis

Wing-Kin Syn et al. Hepatology. 2011 Jan.

Abstract

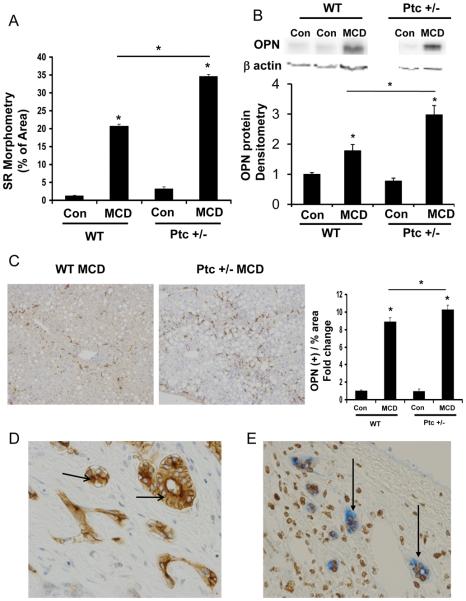
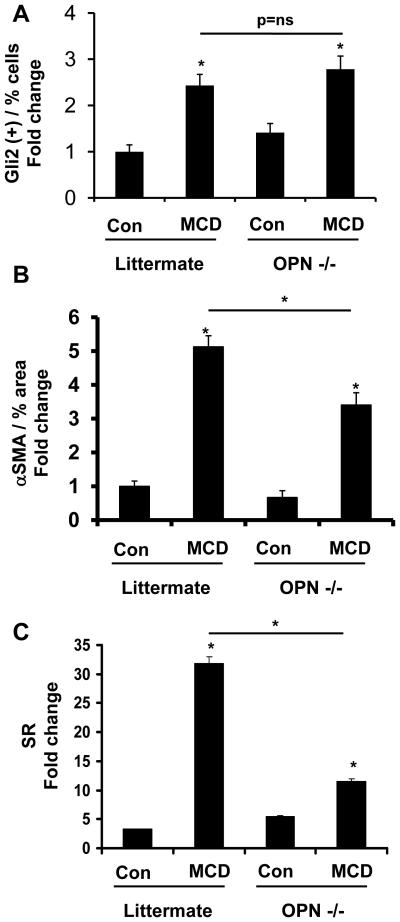
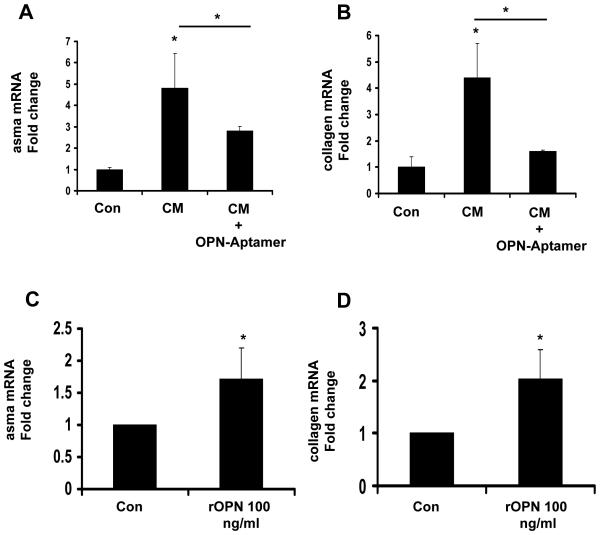
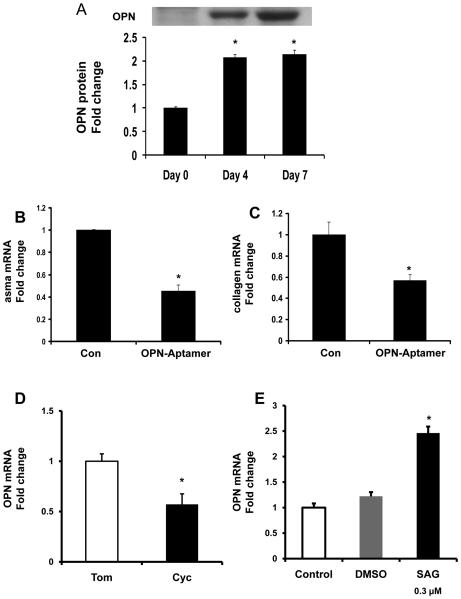
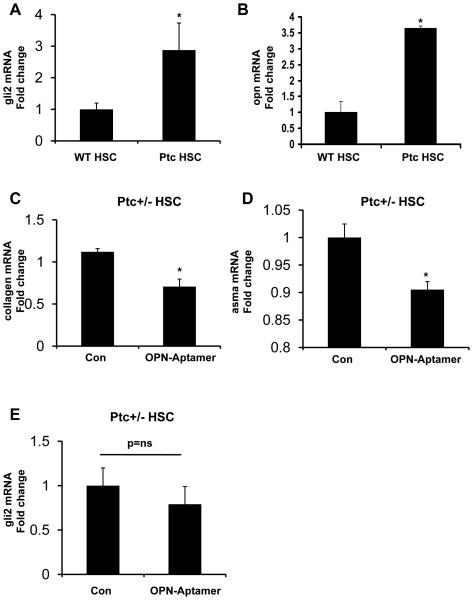
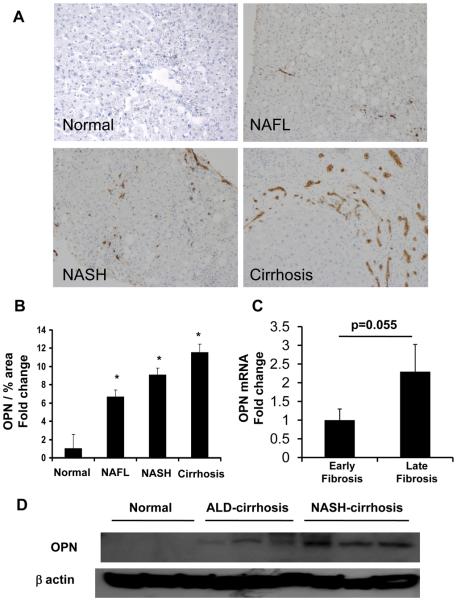
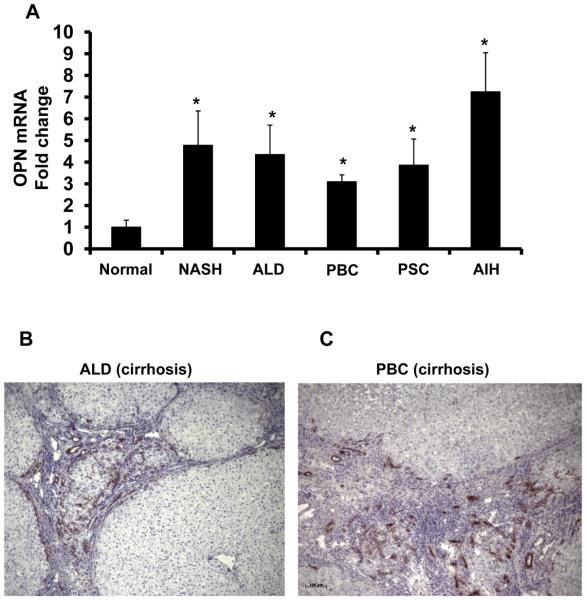
Nonalcoholic steatohepatitis (NASH) is a leading cause of cirrhosis. Recently, we showed that NASH-related cirrhosis is associated with Hedgehog (Hh) pathway activation. The gene encoding osteopontin (OPN), a profibrogenic extracellular matrix protein and cytokine, is a direct transcriptional target of the Hh pathway. Thus, we hypothesize that Hh signaling induces OPN to promote liver fibrosis in NASH. Hepatic OPN expression and liver fibrosis were analyzed in wild-type (WT) mice, Patched-deficient (Ptc(+/-) ) (overly active Hh signaling) mice, and OPN-deficient mice before and after feeding methionine and choline-deficient (MCD) diets to induce NASH-related fibrosis. Hepatic OPN was also quantified in human NASH and nondiseased livers. Hh signaling was manipulated in cultured liver cells to assess direct effects on OPN expression, and hepatic stellate cells (HSCs) were cultured in medium with different OPN activities to determine effects on HSC phenotype. When fed MCD diets, Ptc(+/-) mice expressed more OPN and developed worse liver fibrosis (P < 0.05) than WT mice, whereas OPN-deficient mice exhibited reduced fibrosis (P < 0.05). In NASH patients, OPN was significantly up-regulated and correlated with Hh pathway activity and fibrosis stage. During NASH, ductular cells strongly expressed OPN. In cultured HSCs, SAG (an Hh agonist) up-regulated, whereas cyclopamine (an Hh antagonist) repressed OPN expression (P < 0.005). Cholangiocyte-derived OPN and recombinant OPN promoted fibrogenic responses in HSCs (P < 0.05); neutralizing OPN with RNA aptamers attenuated this (P < 0.05).

Conclusion: OPN is Hh-regulated and directly promotes profibrogenic responses. OPN induction correlates with Hh pathway activity and fibrosis stage. Therefore, OPN inhibition may be beneficial in NASH.


Figures

Figure 1
Figure 1. Osteopontin (OPN) expression parallels Hedgehog (Hh) pathway activation and fibrosis during diet-induced NASH
Wild-type and Ptc+/− mice (with an overly active Hh pathway) were fed control chow (n=8/group) or MCD diet (n=8/group) for 8 weeks, and then sacrificed. (A) Sirius red quantification by morphometric analysis. Sections from 4 animals were used per group and 10 randomly selected, 200X fields chosen for analysis by the Metaview software. (B) Total hepatic OPN expression by Western blot and densitometry. (C) Representative OPN immunostaining after MCD treatment in WT and Ptc+/− mice (final magnification 400X), and quantification by morphometry. Sections from 4 animals were used per group and 8 randomly selected, 200X fields chosen for analysis by the Metaview software. Results are expressed as fold change (% positive staining) relative to chow-fed control mice, and graphed as mean ± SEM. *P<0.05 vs. control mice. (D) Representative OPN (+) biliary ductular cells in murine NASH-fibrosis (630X). (E) Representative OPN (blue) and Gli2 (brown) double-positive ductular cells in human NASH-cirrhosis (400X).
Figure 2
Figure 2. OPN-deficient mice develop less fibrosis after MCD diet treatment
129Sv/J OPN-deficient and littermates were fed MCD diet or control chow (n=6 mice/group/dietary treatment) for 4 weeks. At the end of treatment, mice were sacrificed. (A) Accumulation of Gli2 (+) cells in OPN−/− and littermates. Sections from 6 animals were used, and 8 randomly selected, 400X field chosen for cell counting. (B) αSMA morphometry. Sections from 3 animals were used at each time point and 10 randomly selected, 400X fields chosen for analysis by the Metaview software. (C) Sirius red quantification by morphometric analysis. Sections from 6 animals were used and 10 randomly selected 400X field chosen for analysis. Results are expressed as fold change relative to chow-fed littermates and graphed as mean ± SEM. *P<0.05 vs. littermate control.
Figure 3
Figure 3. Paracrine OPN stimulates hepatic stellate cell (HSC) activation and collagen expression
(A-B) Isolated mouse primary hepatic stellate cells (HSC) were cultured for 4 days, and then treated with conditioned media (CM) from cholangiocytes, with or without OPN-targeted RNA aptamers for 48 hrs. (C-D) In separate experiments, primary HSC were directly treated with recombinant OPN (rOPN: 0 or 100ng/ml) for 24 hrs, and then harvested for QRTPCR analysis. (A, C,) αsma, (B, D) collagen mRNA. Mean ± SEM of duplicate experiments are graphed. *P<0.05 vs. vehicle treated stellate cells.
Figure 4
Figure 4. Hh-regulated OPN overexpression promotes HSC activation in an autocrine fashion
Rat primary HSC were isolated and cultured for 0, 4 and 7 days. At the end of treatment, HSC were washed and cell lysates obtained for Western blot analysis. (A) OPN Western blot and densitometry. In separate experiments, day 4 HSC cultures were treated with OPN-aptamers or null-aptamers (control) for 48 hrs and RNA isolated for QRTPCR (B-C). (B) αsma, (C) collagen mRNA. To assess if OPN expression is Hh-regulated, day 4 HSC were treated with Cyclopamine (Cyc), Tomatidine (Tom), or SAG for 24 hrs, and then harvested for RNA analysis (D-E). (D-E) opn mRNA. Mean ± SEM of duplicate experiments are graphed. * p<0.05 vs. control (vehicle) treated or quiescent stellate cells.
Figure 5
Figure 5. OPN is a downstream target of the Hh pathway
WT and Ptc+/− primary HSC were placed in culture for 4 days and then harvested for RNA analysis by QRTPCR. (A) gli2, (B) opn mRNA; mean ± SEM of duplicate experiments are graphed. *p<0.05 vs. WT HSC. In separate experiments, Ptc+/− HSC were treated with OPN-aptamers or null-aptamers (control) for 48hrs, and effects on fibrogenesis assessed by QRTPCR. (C) collagen, (D) αsma, and (E) gli2 mRNA. Mean ± SEM of triplicate experiments are graphed. * p<0.05 vs. null-aptamer-(control) treated HSC
Figure 6
Figure 6. OPN over-expression in NAFLD patients
Coded liver sections from patients with NAFL, NASH, and NASH-cirrhosis were stained for OPN and analyzed by computer-assisted morphometry. (A) Representative photomicrographs of liver sections from patients with NAFLD and normal liver from excess donor tissues (400X). (B) Quantitative analysis of OPN in all patients. Amount of OPN is expressed as percentage of stained cells per high-powered field. *P <0.05 vs. normal. Total liver RNA was isolated from individuals (n=18/group) with early or late NASH-fibrosis and analyzed by QRTPCR. (C) opn mRNA. Mean ± SEM are graphed * p<0.05 vs early fibrosis. (D) Hepatic OPN protein from normal, ALD-cirrhosis and NASH-cirrhosis individuals
Figure 7
Figure 7. Enrichment of hepatic OPN in patients with chronic liver disease
RNA were harvested from explanted ALD-, NASH-, PBC-, PSC- and AIH-cirrhotic livers and analyzed by QRTPCR. Liver sections from ALD and PBC-cirrhosis were immunostained for OPN. (A) OPN mRNA (n=6/group); results expressed as fold change relative to normal donor livers, mean ± SEM. *p<0.05 vs. normal. (B) Representative OPN immunostaining in ALD-cirrhosis (100X), and (C) PBC-cirrhosis (100X).

Comment in

References

    1. Feldstein AE, Canbay A, Angulo P, Taniai M, Burgart LJ, Lindor KD, Gores GJ. Hepatocyte apoptosis and fas expression are prominent features of human nonalcoholic steatohepatitis. Gastroenterology. 2003;125:437–443. - PubMed
    1. Wieckowska A, Zein NN, Yerian LM, Lopez AR, McCullough AJ, Feldstein AE. In vivo assessment of liver cell apoptosis as a novel biomarker of disease severity in nonalcoholic fatty liver disease. Hepatology. 2006;44:27–33. - PubMed
    1. Feldstein AE, Papouchado BG, Angulo P, Sanderson S, Adams L, Gores GJ. Hepatic stellate cells and fibrosis progression in patients with nonalcoholic fatty liver disease. Clin Gastroenterol Hepatol. 2005;3:384–389. - PubMed
    1. Jung Y, Witek RP, Syn WK, Choi SS, Omenetti A, Premont R, Guy CD, et al. Signals from dying hepatocytes trigger growth of liver progenitors. Gut. 59:655–665. - PMC - PubMed
    1. Choi SS, Omenetti A, Witek RP, Moylan CA, Syn WK, Jung Y, Yang L, et al. Hedgehog pathway activation and epithelial-to-mesenchymal transitions during myofibroblastic transformation of rat hepatic cells in culture and cirrhosis. Am J Physiol Gastrointest Liver Physiol. 2009;297:G1093–1106. - PMC - PubMed

Publication types