. 2011 Jan;63(1):84-95.
doi: 10.1002/art.30099.

Selective ERK activation differentiates mouse and human tolerogenic dendritic cells, expands antigen-specific regulatory T cells, and suppresses experimental inflammatory arthritis

Affiliations
Free PMC article

Selective ERK activation differentiates mouse and human tolerogenic dendritic cells, expands antigen-specific regulatory T cells, and suppresses experimental inflammatory arthritis

Frederick Arce et al. Arthritis Rheum. 2011 Jan.
Free PMC article

Abstract

Objective: Most therapeutic treatments for autoimmune arthritis rely on immunosuppressive drugs, which have side effects. Although a previous study by our group showed that specific ERK activation suppressed immune responses, its application in a therapeutic setting has never been tested. The aim of the present study was to define the ERK-dependent immunosuppressive mechanisms and to apply selective ERK activation for the treatment of experimental inflammatory arthritis.

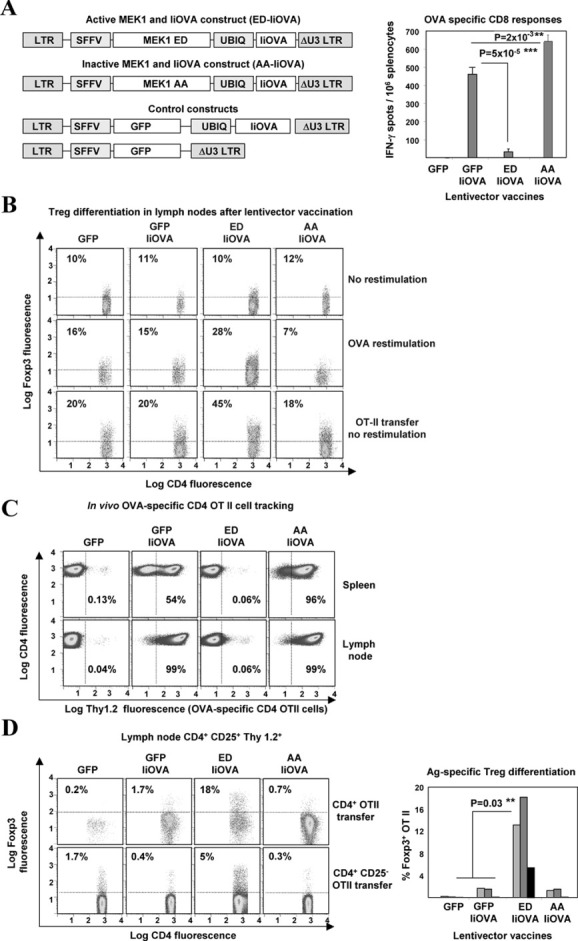
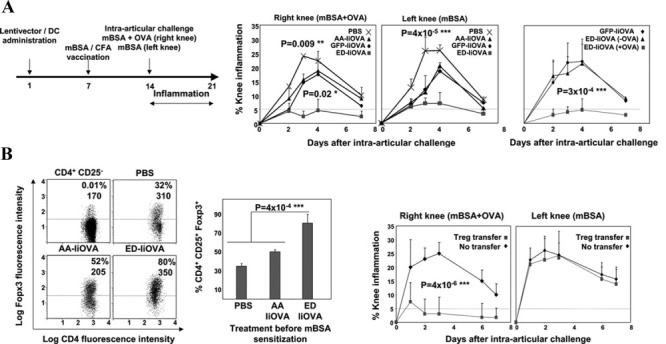
Methods: A constitutively active ERK activator was coexpressed with a model antigen using lentivectors. Immunosuppressive mechanisms were characterized at the level of dendritic cell (DC) function, differentiation of antigen-specific Treg cells, and inhibition of inflammatory T cells. Administration of the ERK activator with antigen as a strategy to suppress inflammatory arthritis was tested in an experimental mouse model.

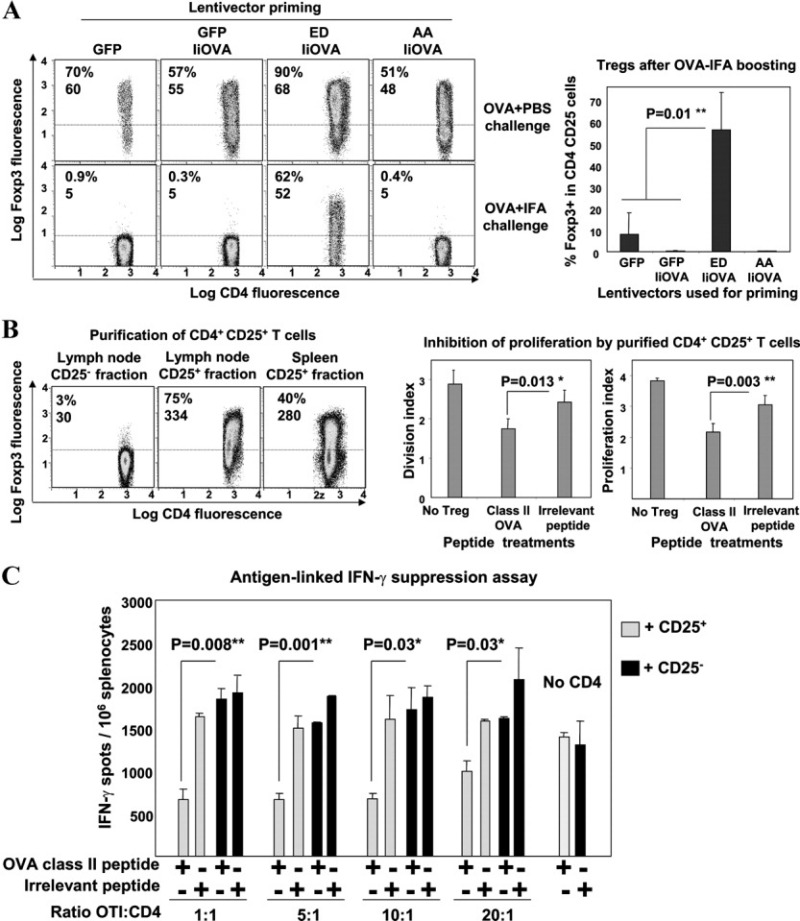
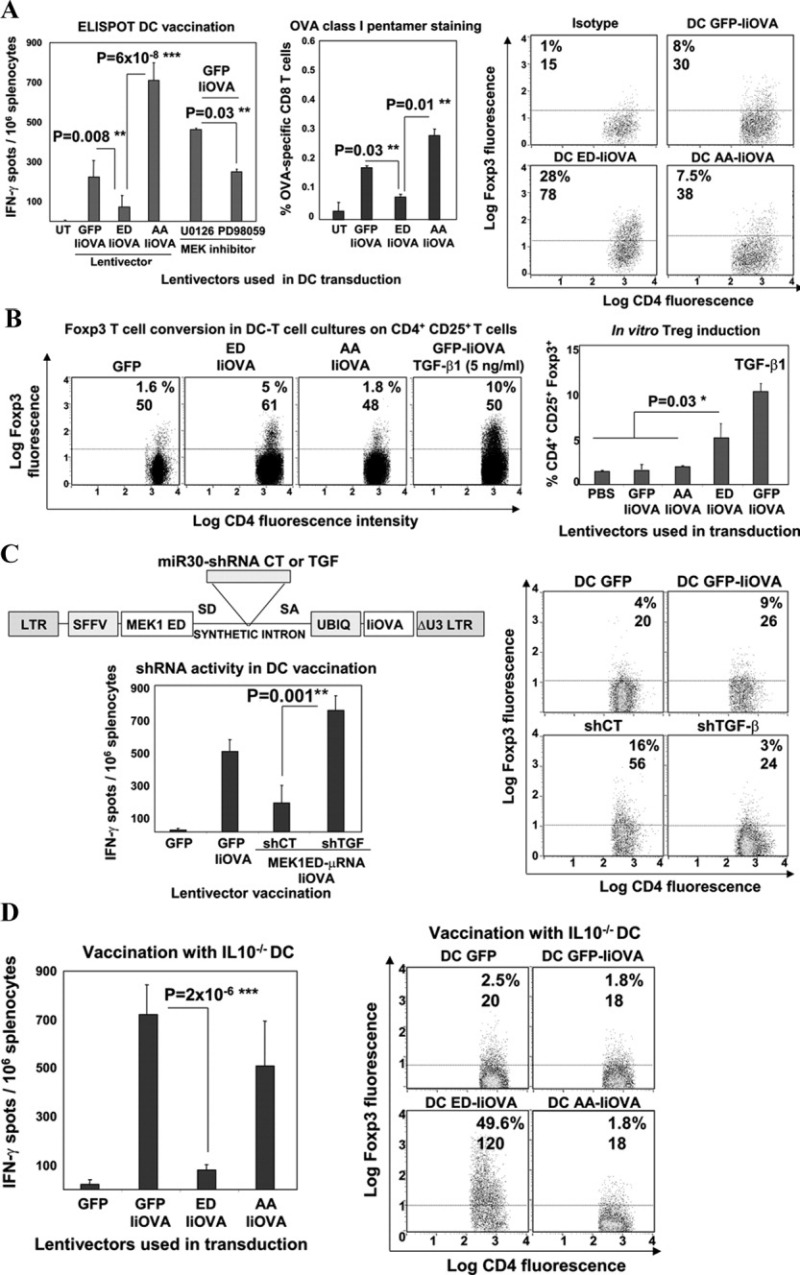
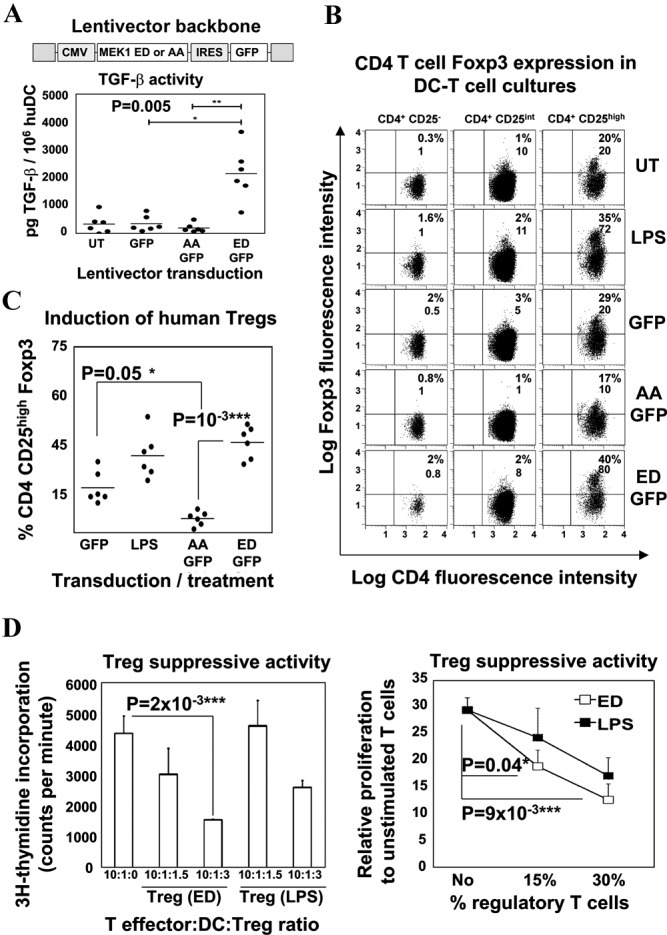
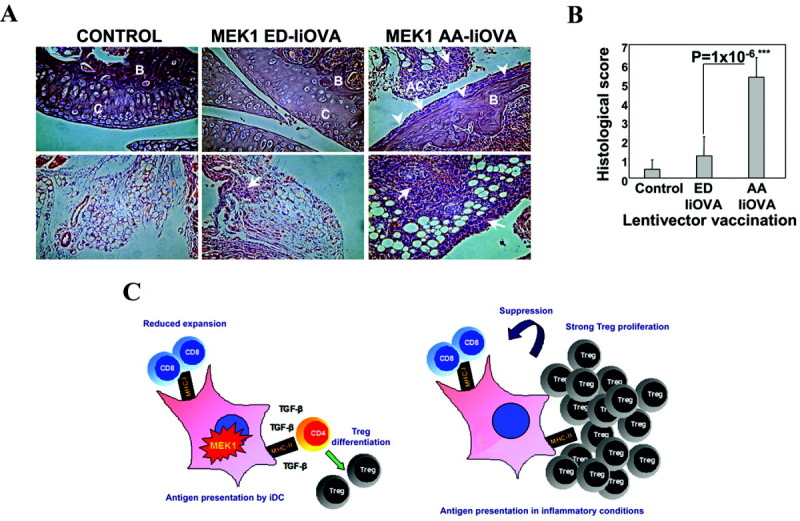
Results: Selective ERK activation induced mouse and human DCs to secrete bioactive transforming growth factor β, a process required for suppression of T cell responses and differentiation of antigen-specific Treg cells. Treg cells strongly proliferated after antigen reencounter in inflammatory conditions, and these cells exhibited antigen-dependent suppressive activities. Inflammatory arthritis was effectively inhibited through antigen-specific mechanisms. Importantly, this strategy did not rely on identification of the initiating arthritogenic antigen. Equivalent mechanisms were demonstrated in human monocyte-derived DCs, setting the scene for a possible rapid translation of this approach to patients with rheumatoid arthritis.

Conclusion: This strategy of selective ERK activation resulted in an effective therapeutic protocol, with substantial advantages over DC or T cell vaccination.


Figures

Figure 1
Figure 1
ERK activation prevents T cell expansion and differentiates FoxP3+CD4+ T cells. A, Left, Schemes of lentiviral constructs coexpressing MEK-1 ED (for active MEK-1) or MEK-1 AA (for inactive MEK-1) with the class II major histocompatibility complex fusion antigen invariant-chain ovalbumin (IiOVA), or control constructs expressing green fluorescent protein (GFP) with or without IiOVA. Right, Ovalbumin (OVA)–specific CD8 T cell responses, as determined by interferon-γ (IFNγ) enzyme-linked immunospot assay, in mouse spleens after lentivector vaccination. Bars show the mean ± SD results in 5 mice per group. B, FoxP3 expression in lymph node CD4+CD25+ T cells after lentivector vaccination, without or with OVA restimulation and after intravenous transfer of OVA-specific CD4+ OT-II cells without restimulation. Values are the percentage of FoxP3+ T cells. C, Thymocyte antigen 1.2 (Thy1.2) expression in lymph node CD4+ T cells from Thy1.1+ mice that received transferred Thy1.2+ OT-II cells. Values are the percentage of Thy1.2+ T cells. D, Left, FoxP3 expression from lymph node Thy1.2+CD4+CD25+ T cells in lentivector-vaccinated Thy1.1+ mice after transfer of CD4+ OT-II cells or CD4+CD25− OT-II cells. Values are the percentage of FoxP3+ T cells. Right, FoxP3 expression in OT-II cells after lentivector vaccination in 3 independent experiments (each represented as a differently shaded bar). Horizontal or vertical broken line indicates the cutoff for positivity. ∗∗ = very significant difference (P < 0.01); ∗∗∗ = highly significant difference (P < 0.001). LTR = long terminal repeat; SFFV = spleen focus–forming virus; UBIQ = ubiquitin; Ag = antigen.
Figure 2
Figure 2
Antigen-specific FoxP3+ Treg cells undergo expansion after antigen reencounter. A, Left, FoxP3 expression in lymph node CD4+CD25+ T cells following lentivector vaccination (control constructs expressing GFP or GFP plus IiOVA, and constructs with active MEK-1 [ED] or inactive MEK-1 [AA] plus IiOVA) and rechallenge with OVA plus phosphate buffered saline (PBS) or Freund's incomplete adjuvant (IFA). Values are the percentage and mean fluorescence intensity (MFI) of FoxP3 expression. Right, Expression of FoxP3+ cells in lymph node Treg cells after lentivector priming and OVA plus IFA boosting. B, Left, FoxP3 expression in purified lymph node CD4+CD25+ T cells or spleen CD4+CD25+ T cells after active MEK-1–IiOVA priming and OVA plus IFA boosting. Values are the percentage and MFI of FoxP3 expression. Right, Inhibition of T cell proliferation according to treatment group (no Treg cells, class II OVA peptide, or irrelevant peptide), as measured by the division index and proliferation index. In A and B, the horizontal broken line indicates the cutoff for positivity. C, CD8+ IFNγ responses in peptide-pulsed OT-I mouse splenocytes incubated with purified Treg cells at the indicated ratios. A class II OVA peptide or an irrelevant peptide was present (+) or absent (−) in the assays with CD25+ or CD25− cells. Bars in A–C show the mean ± SEM results in 5 mice per group. ∗ = very significant difference (P < 0.01); ∗∗ = highly significant difference (P < 0.001). See Figure 1 for other definitions.
Figure 3
Figure 3
ERK-dependent immunosuppression is dependent on dendritic cell (DC)–derived transforming growth factor β (TGFβ). A, Left, CD8 T cell responses, as determined by IFNγ enzyme-linked immunospot (ELISpot) assay or OVA class I pentamer staining, after vaccination with lentivector-modified DCs (or untransduced [UT] DCs as control) or after MEK inhibitor treatments. Right, FoxP3 expression in splenocyte CD4+CD25+ T cells after lentivector vaccination. Values are the percentage and mean fluorescence intensity (MFI) of FoxP3+ expression. B, Left, FoxP3 expression in CD4+CD25+ OT-II cells cultured with transduced DCs. Values are the percentage and MFI of FoxP3 expression. Right, In vitro Treg cell induction of FoxP3 expression in the DC–T cell cocultures, without or with TGFβ1 treatment at 5 ng/ml. C, Left (top), Scheme of the lentivector short hairpin RNA (shRNA) delivery platform, highlighting the intron with microRNA miR-30 shRNA. Left (bottom), CD8+ T cell responses, as determined by IFNγ ELISpot assay, after vaccination with ex vivo lentivector-modified DCs and codelivery with TGFβ-targeted shRNA (shTGF) or control shRNA (shCT). Right, FoxP3 expression in splenocyte CD4+CD25+ T cells after vaccination with lentivector-modified DCs or shRNA, followed by OVA restimulation. Values are the percentage and MFI of FoxP3+ expression. D, Left, OVA-specific CD8 responses, as determined by IFNγ ELISpot assay, in mice vaccinated with lentivector-transduced interleukin-10–knockout (IL-10−/−) DCs. Right, FoxP3 expression in splenocyte CD4+CD25+ T cells vaccinated with transduced IL-10−/− DCs. Values are the percentage and MFI of FoxP3+ expression. Horizontal broken lines indicate the cutoff for positivity. Bars in A–D show the mean ± SEM. ∗ = significant difference (P < 0.05); ∗∗ = very significant difference (P < 0.01); ∗∗∗ = highly significant difference (P < 0.001). PBS = phosphate buffered saline; SD = splicing donor site; SA = splicing acceptor site (see Figure 1 for other definitions).
Figure 4
Figure 4
Selective ERK activation differentiates regulatory human monocyte–derived dendritic cells (huDC). A, Top, Construct with the active (ED) or inactive (AA) MEK-1 and the indicated cytomegalovirus (CMV) promoter and internal ribosome entry site (IRES) leading to GFP expression. Bottom, Transforming growth factor β (TGFβ) activity in supernatants of transduced huDC cultures, as assessed in SMAD-GFP cells. B, FoxP3 expression, as assessed by flow cytometry, in T cells from allogeneic huDC–naive CD4+ T cell cocultures. DCs were left untransduced (UT) or were transduced with the various lentivectors. T cells were gated according to CD25 expression (CD25−, CD25intermediate [CD25int], and CD25high). Values are the percentage and mean fluorescence intensity (MFI) of FoxP3+ expression. LPS = lipopolysaccharide-matured DCs (positive control). C, Percentage of induced CD4+CD25+FoxP3+ T cell expression in 6 different donor combinations (solid circles) using transduced DCs with the indicated lentivectors. In A and C, horizontal bars show the mean. D, Left, Proliferation of target CD8 T cells in a representative experiment, as a function of the proportion of Treg cells purified from the same cultures as described in B, with results expressed as level of 3H-thymidine incorporation. Right, Proliferation of CD8+ T cells in response to stimulation with various percentages of Treg cells, relative to that in unstimulated T cells. Bars show the mean ± SEM data from 3 independent experiments. LPS = T cells purified from LPS-treated huDC/T cell cocultures; ED = T cells purified from ERK-activated huDC/T cell cocultures. ∗ = significant difference (P < 0.05); ∗∗ = very significant difference (P < 0.01); ∗∗∗ = highly significant difference (P < 0.001). See Figure 1 for other definitions.
Figure 5
Figure 5
In vivo delivery of the ERK activator effectively inhibits murine antigen-induced arthritis without targeting the arthritogenic antigen. A, Left, Experimental vaccination regimen used to induce arthritis. Arrows at the top indicate the day on which each step took place. Middle, Extent of inflammation after intraarticular challenge with methylated bovine serum albumin (mBSA) in the presence (right knee) or absence (left knee) of OVA, following vaccination with the constructs containing phosphate buffered saline (PBS), the inactive (AA) or active (ED) ERK forms with IiOVA, or GFP with IiOVA. Right, Extent of inflammation in experiments with the ERK activator (ED) after intraarticular challenges performed in the absence (−) or presence (+) of OVA. B, Left, FoxP3 expression in CD4+CD25+ T cells, as assessed by flow cytometry, from draining lymph nodes of mice after vaccination with the indicated lentivectors and induction of antigen-induced arthritis (AIA). Analyses were performed on day 4 postchallenge. Values are the percentage and mean fluorescence intensity (MFI) of FoxP3+ expression. Middle, FoxP3 expression in CD4+CD25+ T cells from draining lymph nodes after lentivector vaccination and induction of AIA. Right, Extent of knee inflammation after OVA-specific Treg cell transfer to mBSA-sensitized mice before challenge. Bars show the mean ± SEM. The horizontal broken lines indicate the cutoff for positivity. ∗ = significant difference (P < 0.05); ∗∗ = very significant difference (P < 0.01); ∗∗∗ = highly significant difference (P < 0.001). CFA = Freund's complete adjuvant (see Figure 1 for other definitions).
Figure 6
Figure 6
Prevention of joint destruction by delivery of the ERK activator (A and B), and working model for ERK-dependent immunosuppression (C). A, Photomicrographs show hematoxylin and eosin–stained mouse knee joint sections after challenge with methylated bovine serum albumin (mBSA) and OVA. Top panels, Articular cartilage and bone sections. Bottom panels, Articular capsule. In the control group (intraarticular injection with mBSA + OVA in naive mice), the joints show an absence of inflammation and a lack of cellular infiltration. In the group vaccinated with the ERK activator and IiOVA (MEK1 ED–IiOVA) before induction of antigen-induced arthritis (AIA), the integrity of the articular cartilage and bone is evident, with limited cellular infiltration in the articular capsule (arrow). In the group vaccinated with the inactive MEK-1 mutant and IiOVA (MEK1 AA–IiOVA) before induction of AIA, destruction of articular cartilage and bone is evident (arrowheads), with extensive cellular infiltration (arrows). Original magnification × 40. B = trabecular bone; C = articular cartilage; AC = articular capsule. B, Histologic scores were determined to measure the extent of joint destruction and inflammation after lentivector vaccination. Bars show the mean ± SEM results in 5 mice per group. ∗∗∗ = highly significant difference (P < 0.001). C, Left, ERK-activated immature dendritic cells (iDC) present antigen under suboptimal conditions to T cells, leading to reduced CD8 T cell expansion. Transforming growth factor β (TGFβ) drives antigen-specific Treg cell differentiation rather than expansion of effector CD4+ T cells. Right, A second antigen exposure under inflammatory conditions drives strong Treg cell proliferation, with antigen-specific suppressive activities. MHC-I = class I major histocompatibility complex.

References

    1. Flores-Borja F, Mauri C, Ehrenstein MR. Restoring the balance: harnessing regulatory T cells for therapy in rheumatoid arthritis. Eur J Immunol. 2008;38:934–7. - PubMed
    1. Imperato AK, Bingham CO, III, Abramson SB. Overview of benefit/risk of biological agents. Clin Exp Rheumatol. 2004;22:S108–14. - PubMed
    1. Wright GP, Notley CA, Xue SA, Bendle GM, Holler A, Schumacher TN, et al. Adoptive therapy with redirected primary regulatory T cells results in antigen-specific suppression of arthritis. Proc Natl Acad Sci U S A. 2009;106:19078–83. - PMC - PubMed
    1. Riley JL, June CH, Blazar BR. Human T regulatory cell therapy: take a billion or so and call me in the morning. Immunity. 2009;30:656–65. - PMC - PubMed
    1. Rutella S, Danese S, Leone G. Tolerogenic dendritic cells: cytokine modulation comes of age. Blood. 2006;108:1435–40. - PubMed

Publication types

MeSH terms