. 2010 Nov 16;26(22):17363-8.
doi: 10.1021/la103024f. Epub 2010 Oct 22.

Orientation of tie-lines in the phase diagram of DOPC/DPPC/cholesterol model biomembranes

Affiliations

Orientation of tie-lines in the phase diagram of DOPC/DPPC/cholesterol model biomembranes

Pradeep Uppamoochikkal et al. Langmuir. .

Abstract

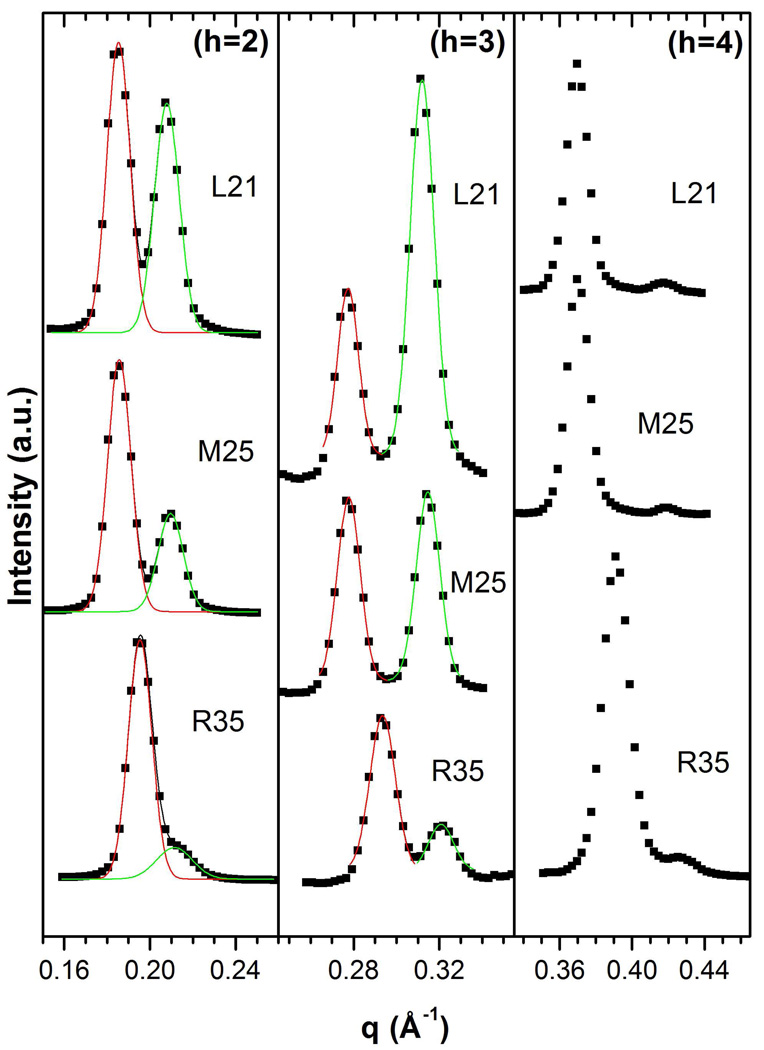
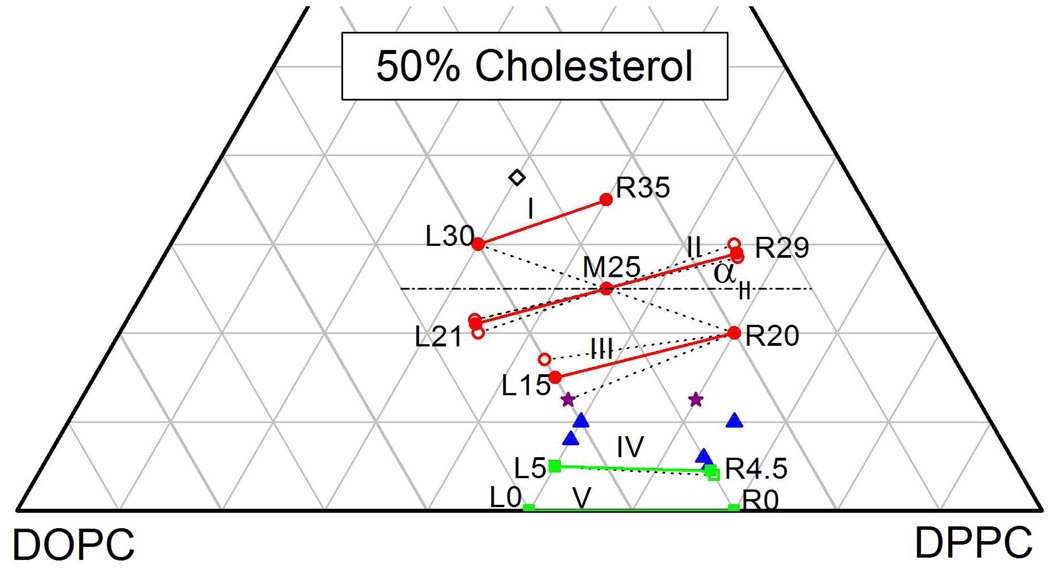
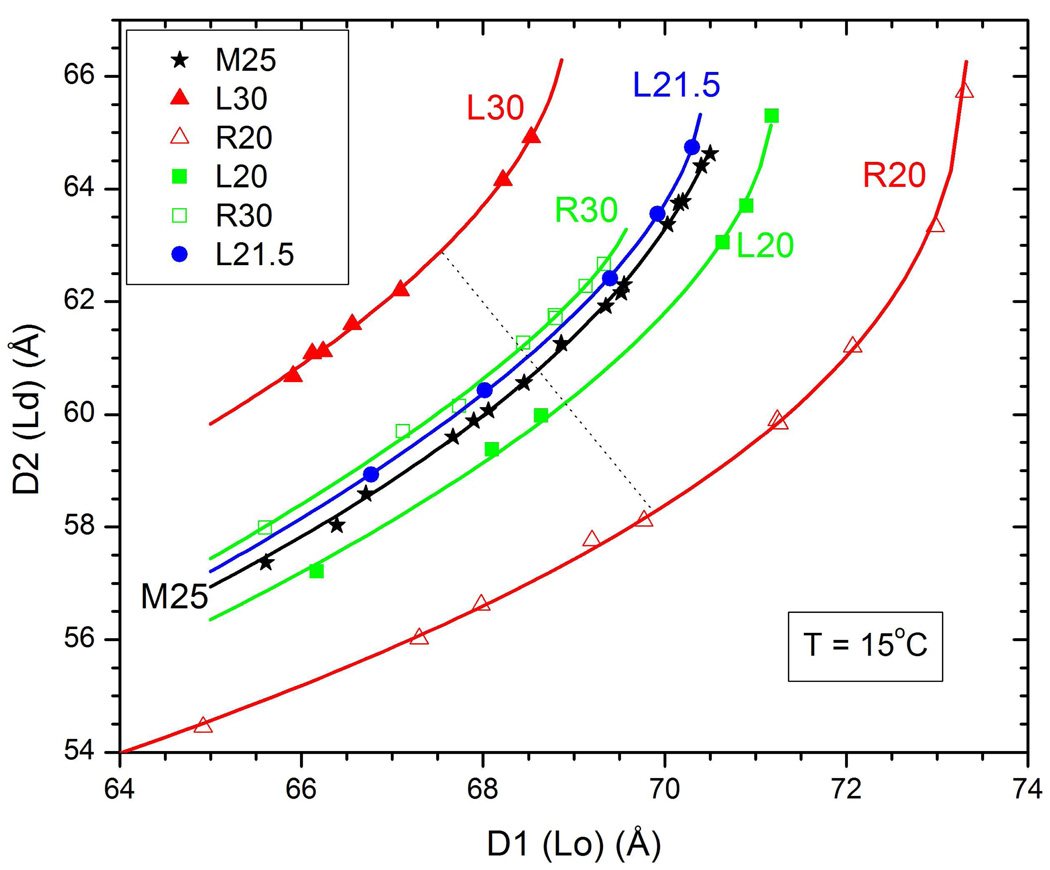
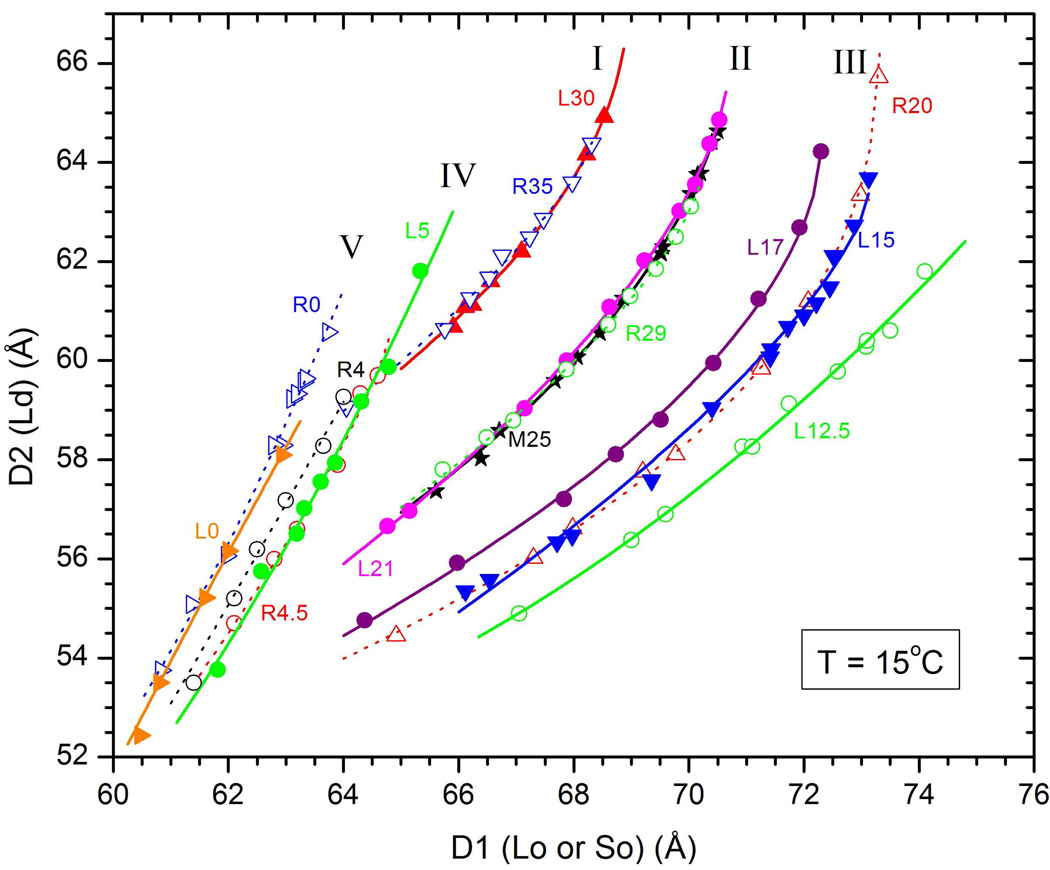
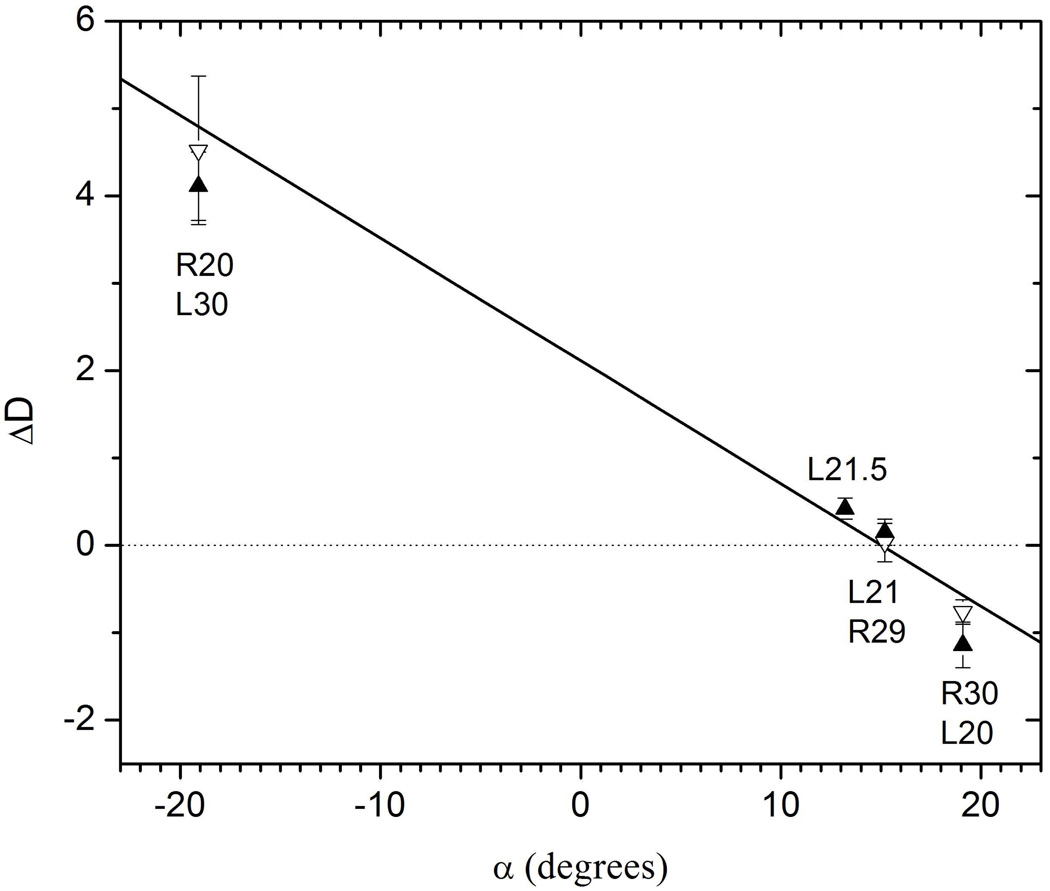
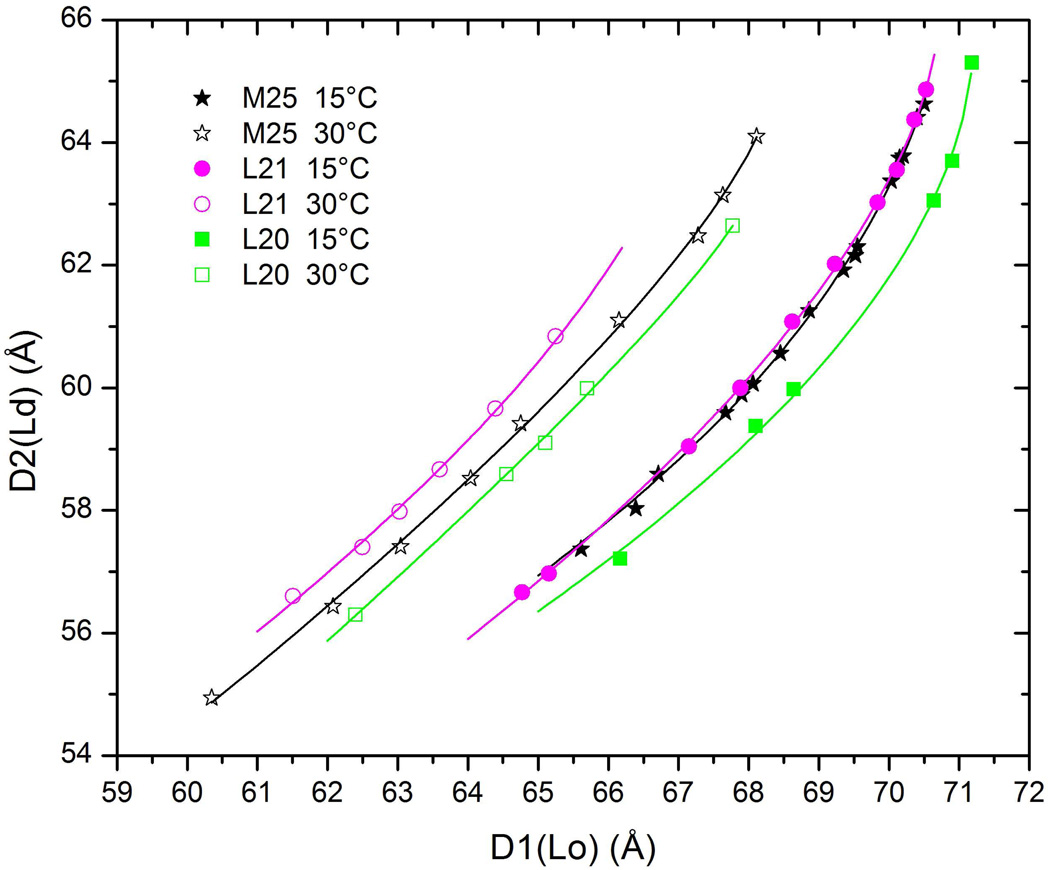
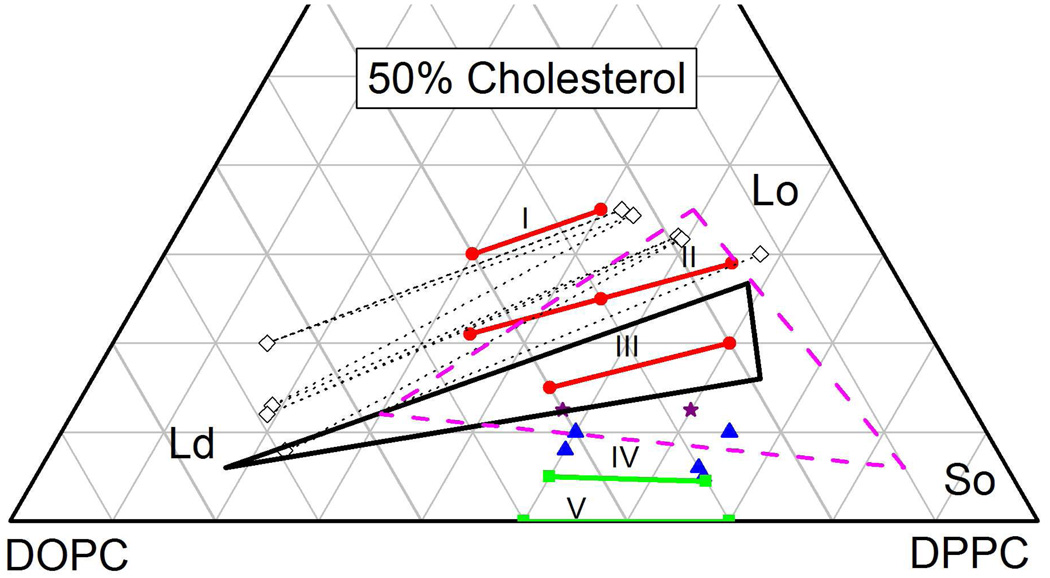
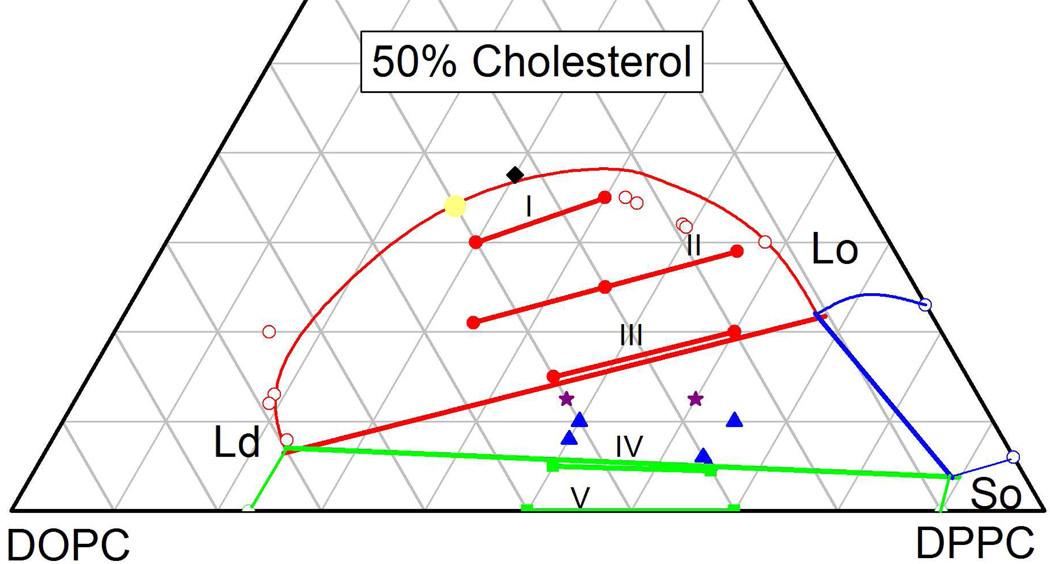
We report the direction of tie-lines of coexisting phases in a ternary diagram of DOPC/DPPC/cholesterol lipid bilayers, which has been a system of interest in the discussion of biological rafts. For coexisting Ld and Lo phases, we find that the orientation angle α of the tie-lines increases as the cholesterol concentration increases and it also increases as temperature increases from T = 15 °C to T = 30 °C. Results at lower cholesterol concentrations support the existence of a different two-phase coexistence region of Ld and So phases and the existence of a three-phase region separating the two two-phase regions. Our method uses the X-ray lamellar D-spacings observed in oriented bilayers as a function of varying hydration. Although this method does not obtain the ends of the tie-lines, it gives precise values (±1°) of their angles α in the ternary phase diagram.


Figures

Figure 1
Figure 1
Lamellar peak data (squares) versus q for orders h=2–4 for three samples, L21, M25 and R35. The green and red lines are Gaussian fits and uncertainties in their peak positions correspond to 0.2 Å uncertainties in D-spacings.
Figure 2
Figure 2
A truncated ternary DOPC:DPPC:Chol Gibbs composition triangle showing compositions of studied samples with some of their short names. Table 1 lists all numerical compositions by name. Circles (red) indicate compositions with Ld-Lo coexistence, squares (green) indicate Ld-So coexistence, triangles (blue) indicate Ld-Lo-So coexistence, stars (purple) could be either in 2-phase or in 3-phase coexistence, and the open (black) diamond is in a single phase. The solid lines labeled with Roman numerals show the orientations of our best determined tie-lines at T=15°C and the dashed lines show orientations that were determined not to be tie-lines. The ends of the tie-lines were not determined in this study, so the tie-lines shown are partial fragments of the tie-lines that must extend further in both directions.
Figure 3
Figure 3
D2 is the repeat spacing of the Ld phase and D1 is the repeat spacing of the Lo phase for many different equilibrated hydration levels for six samples with short names indicated in the legend. Lines are fits of Eq. 1 to the data. Deviations of individual D values from these lines are consistent with the uncertainties obtained from fitting the data in Fig. 1. The different L and R samples are equidistant from the M25 sample in the composition triangle in Fig. 2. For quantitative error analysis average differences between hydration curves along several lines like the dotted line were used.
Figure 4
Figure 4
Double D-spacing data that locate tie-lines: I (L30-R35 with αI=19.2°), II (L21-M25-R29 with αII=15.2°), III (L15-R20 with αIII=14.1°), IV (L5-R4.5 with αIV=−2°) and V (L0-R0 with αV=0). Solid lines are fits to the L data (solid symbols) and dotted lines are fits to the R data (open symbols).
Figure 5
Figure 5
Differences ΔD between curves of the double D-spacing data in Figs. 3 and 4 relative to the M25 data as a function of α which is the angle of the lines passing through M25 in Fig. 2. Solid symbols are for the L compositions and the open symbols are for the R compositions. The linear fit to all data is shown by the solid line.
Figure 6
Figure 6
Temperature dependence of the double D-spacing data which show that αII rotates from 15.2° at 15 °C to 17.1° at 30 °C. Data not shown indicate that dαII/dT increases with increasing T.
Figure 7
Figure 7
NMR tie-lines of VSKG are shown by dotted straight lines and open diamonds show endpoints at the 2-phase Ld-Lo boundary. The Ld-Lo-So 3-phase region is shown as a solid black triangle and the dashed magenta triangle is the 3-phase region from DCJ. As in Fig. 2, the orientation (not the endpoints) of our tie-lines are labeled I–V. The red circles and the green squares are in 2-phase regions, the blue triangles are in a 3-phase region and the purple stars could be either in 2-phase or 3-phase regions. All results are for T=15 °C except for T=18 °C for the 3-phase triangle of DCJ.
Figure 8
Figure 8
Suggested phase diagram at T=15 °C. The Ld-So 2-phase region is enclosed by three straight green lines and contains our IV and V tie-line fragments; the two open green circles at zero Chol show the coexistence compositions of Mitsui. The Ld-Lo 2-phase region is enclosed by one straight and one curved line and it contains our I, II and III tie-line fragments; the open red circles show the coexistence compositions of VSKG. The Lo-So 2-phase region is enclosed by two straight and one curved blue lines; the open blue circles at zero DOPC show the coexistence compositions of Vist and Davis. The yellow point suggests the location of an upper consulate (critical) point and we found only one D-spacing for the composition of the black diamond.

References

    1. Nagle JF, Scott HL. Physics Today. 1978;31:38.
    1. Munro S. Cell. 2003;115:377. - PubMed
    1. Feigenson GW. Nat Chem Biol. 2006;2:560. - PMC - PubMed
    1. Almeida PF. Biochim Biophys Acta. 2009;1788:72. - PubMed
    1. Frazier ML, Wright JR, Pokorny A, Almeida PFF. Biophys J. 2007;92:2422. - PMC - PubMed

Publication types

MeSH terms