. 2010 Nov 23;4(11):6903-13.
doi: 10.1021/nn102272n. Epub 2010 Oct 22.

Controlled release of biologically active silver from nanosilver surfaces

Affiliations

Controlled release of biologically active silver from nanosilver surfaces

Jingyu Liu et al. ACS Nano. .

Abstract

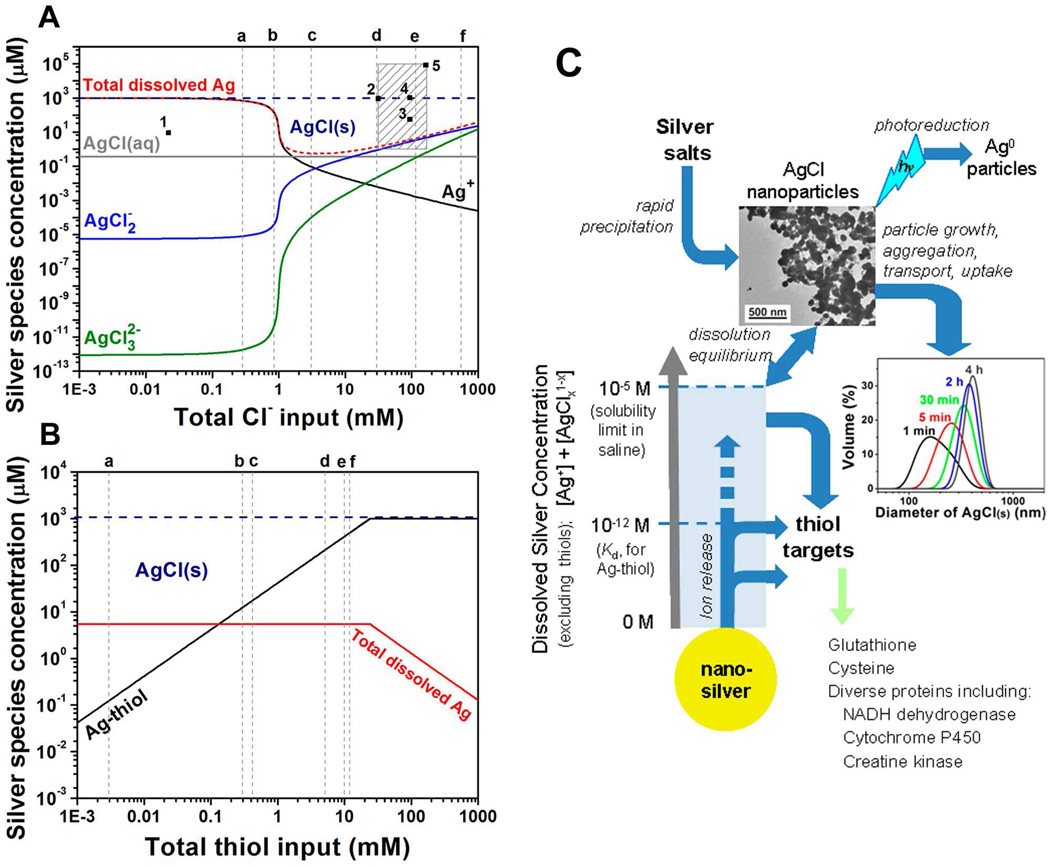
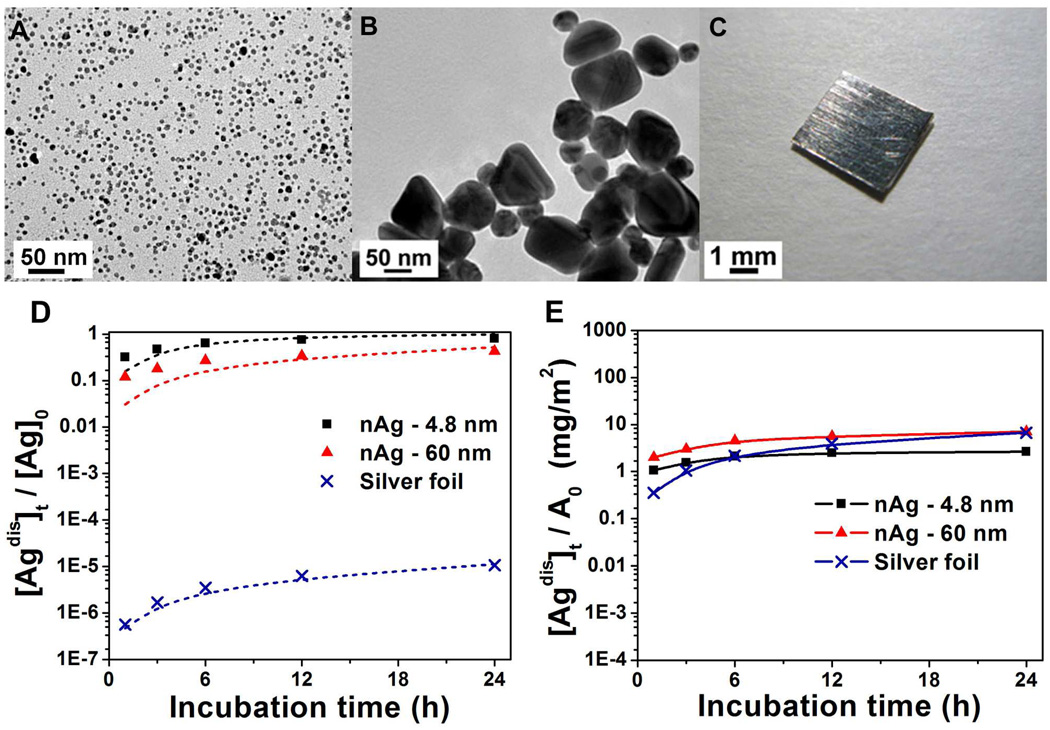
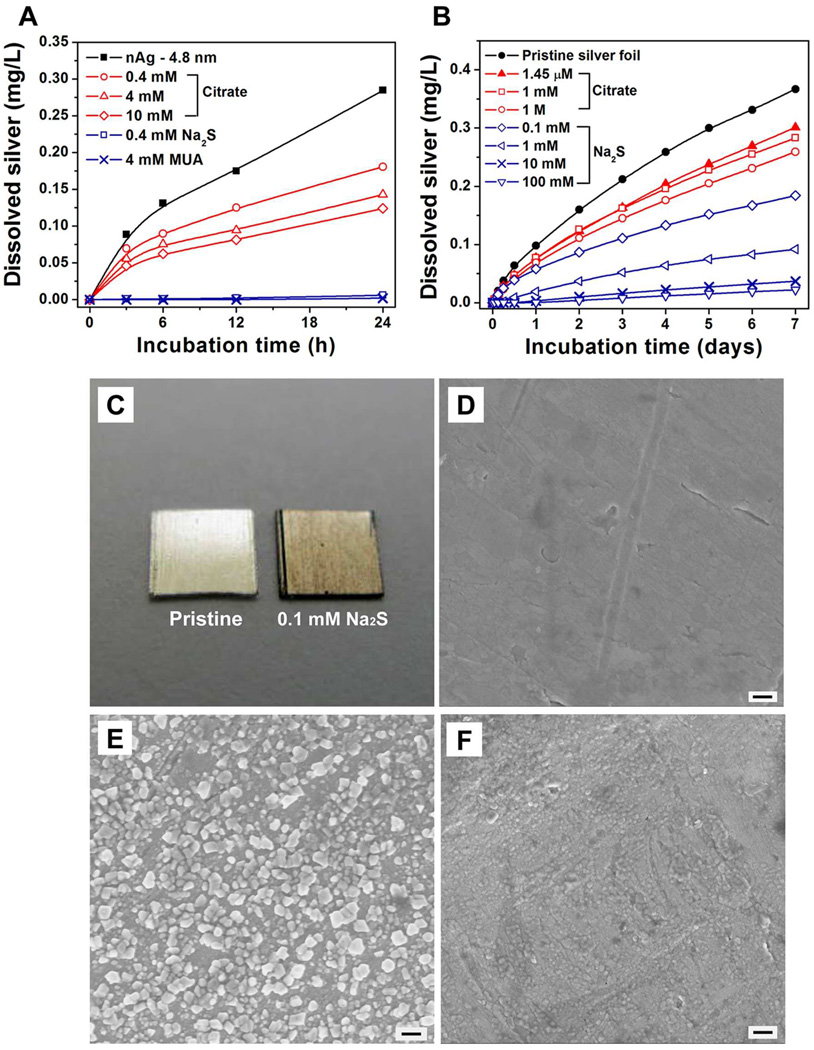
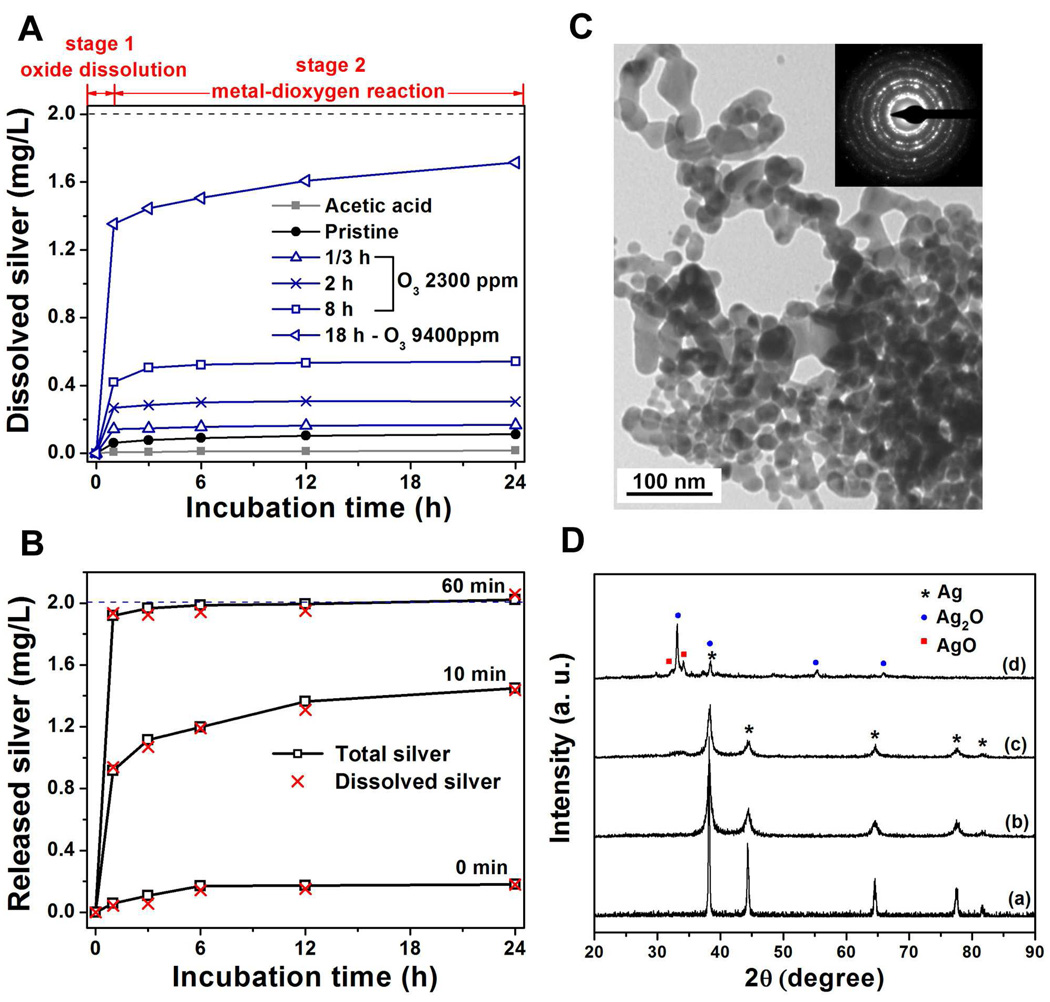
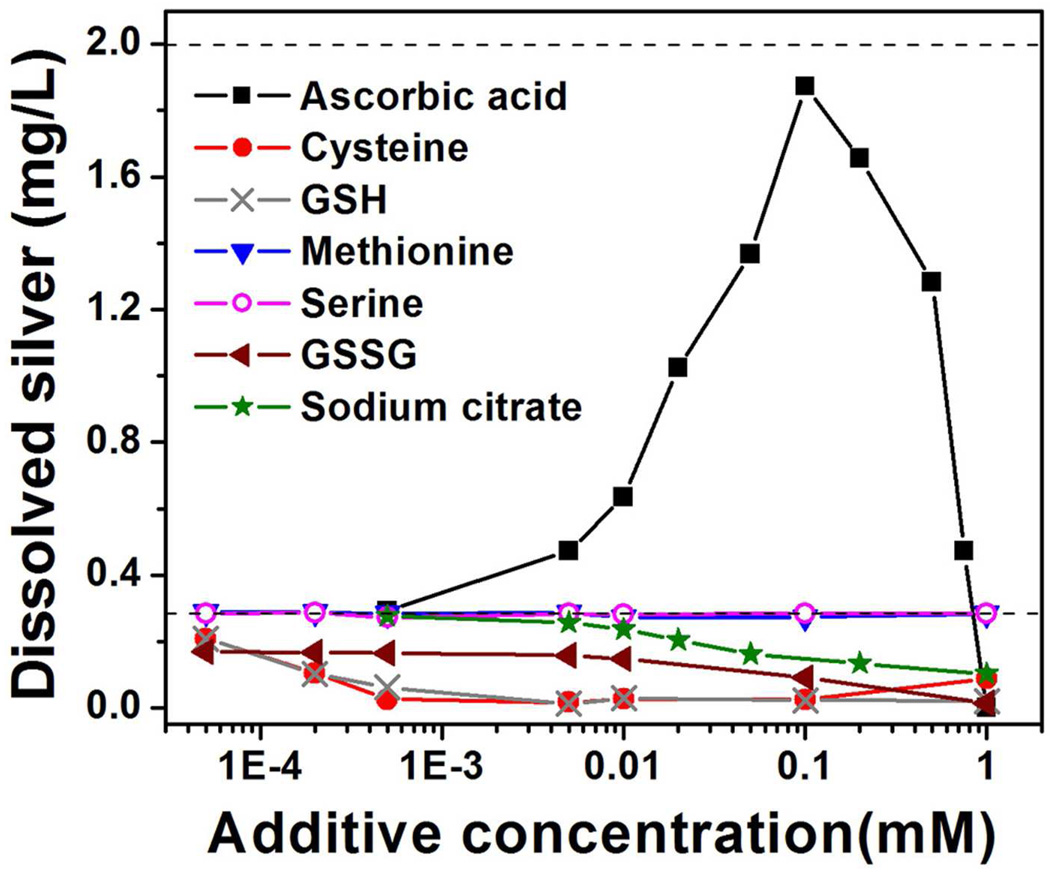
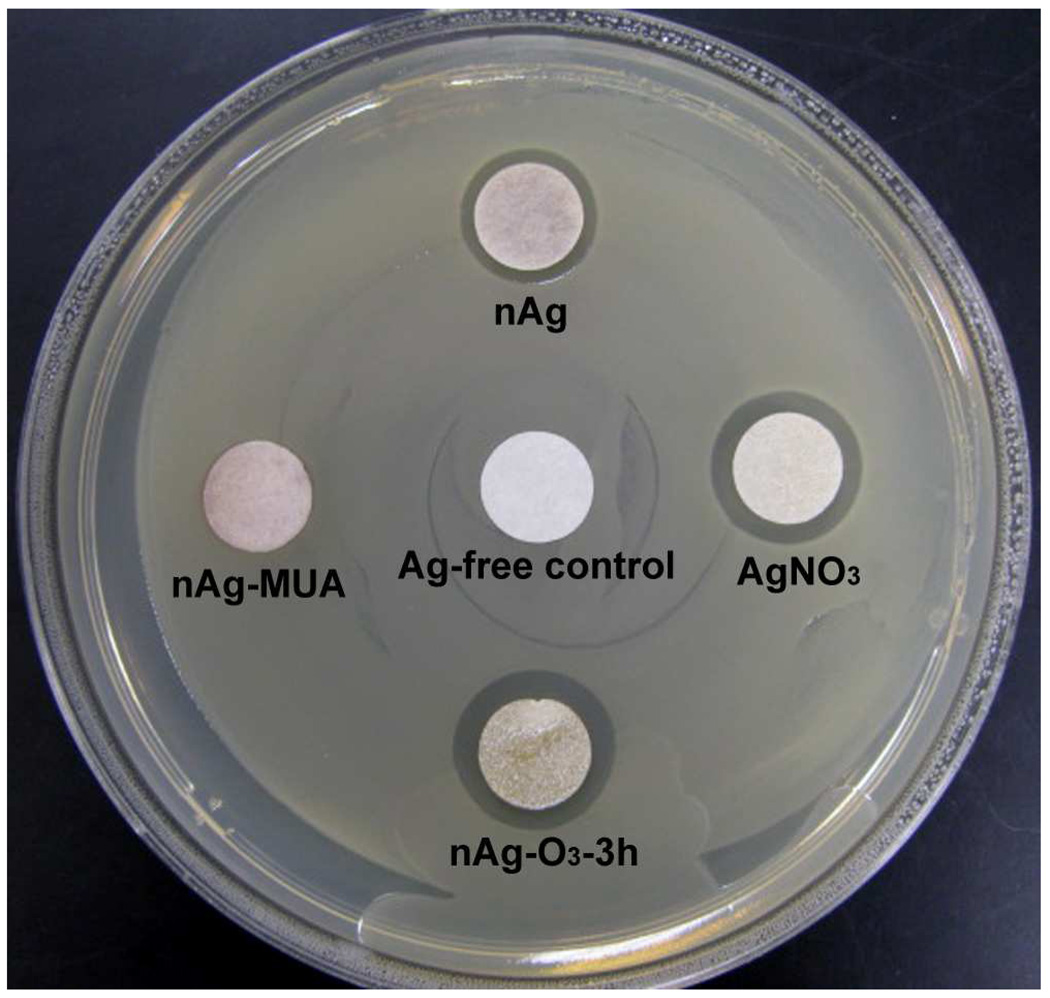
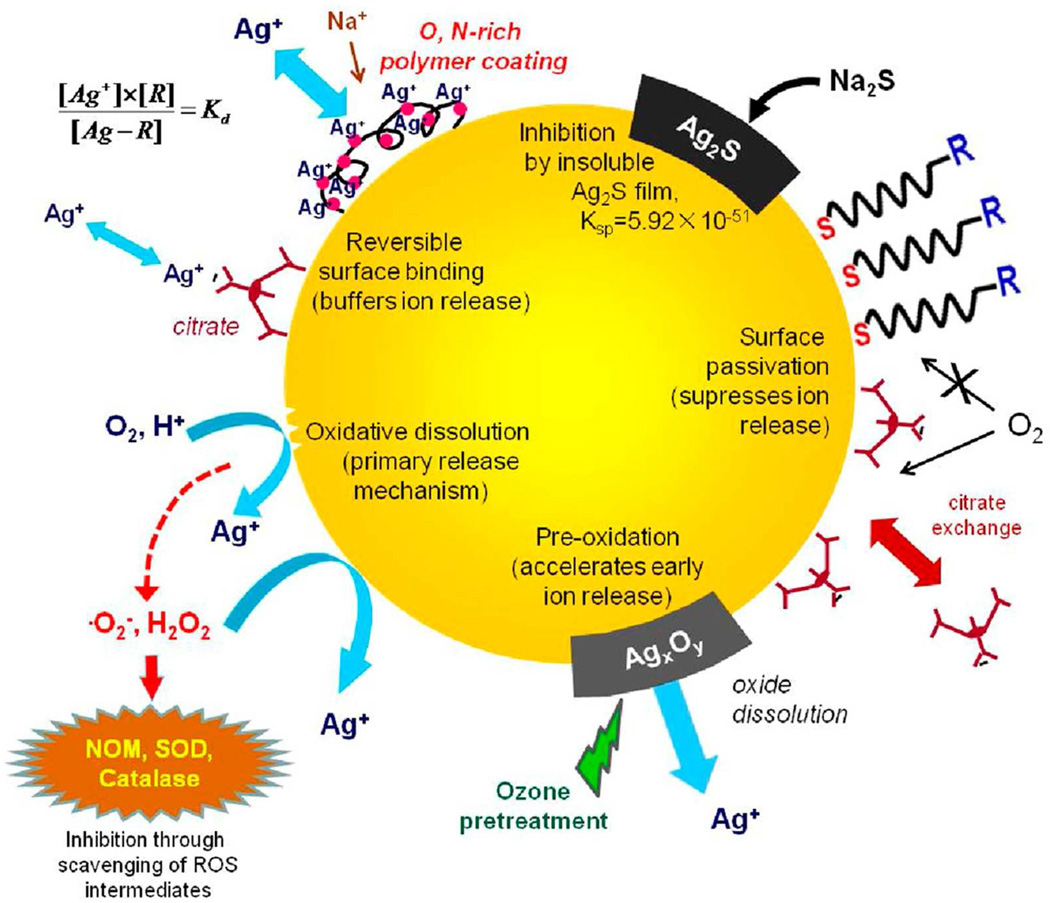
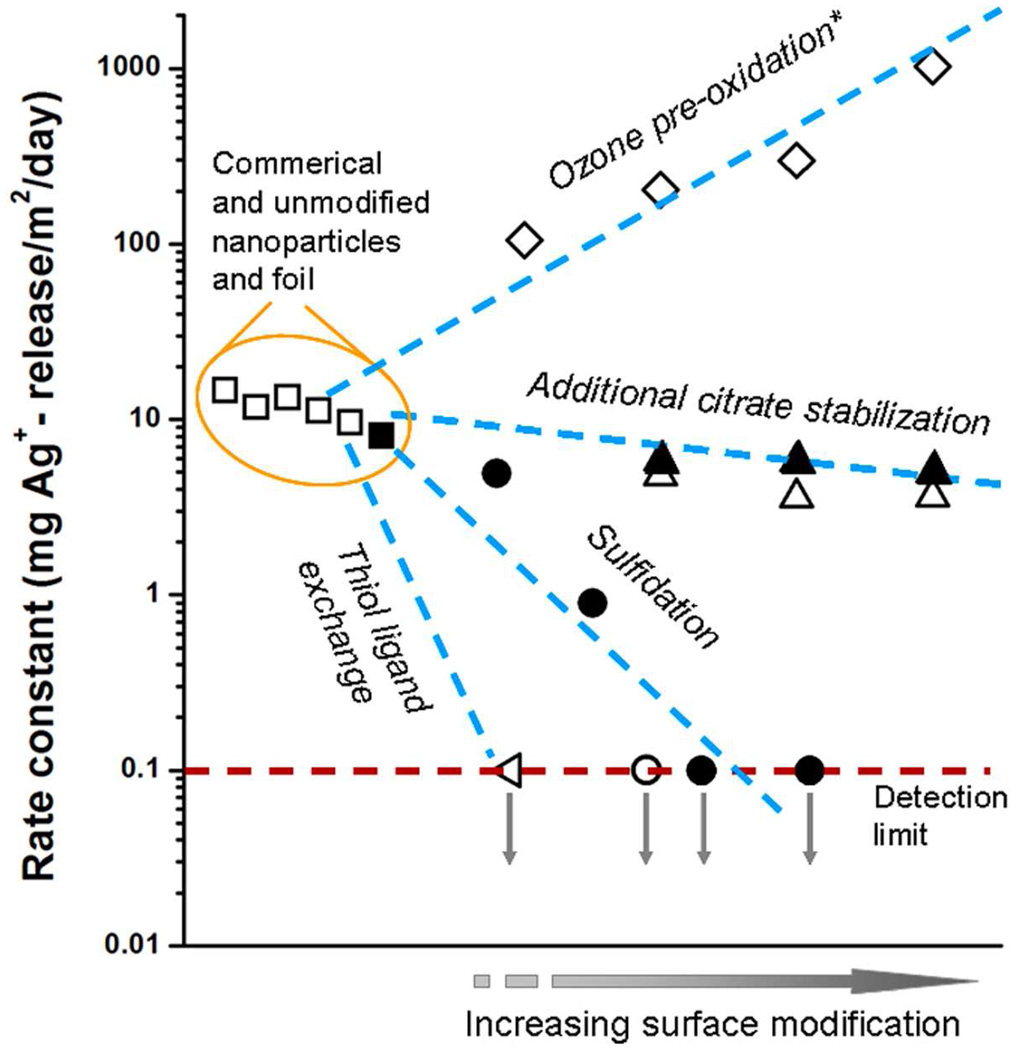
Major pathways in the antibacterial activity and eukaryotic toxicity of nanosilver involve the silver cation and its soluble complexes, which are well established thiol toxicants. Through these pathways, nanosilver behaves in analogy to a drug delivery system, in which the particle contains a concentrated inventory of an active species, the ion, which is transported to and released near biological target sites. Although the importance of silver ion in the biological response to nanosilver is widely recognized, the drug delivery paradigm has not been well developed for this system, and there is significant potential to improve nanosilver technologies through controlled release formulations. This article applies elements of the drug delivery paradigm to nanosilver dissolution and presents a systematic study of chemical concepts for controlled release. After presenting thermodynamic calculations of silver species partitioning in biological media, the rates of oxidative silver dissolution are measured for nanoparticles and macroscopic foils and used to derive unified area-based release kinetics. A variety of competing chemical approaches are demonstrated for controlling the ion release rate over 4 orders of magnitude. Release can be systematically slowed by thiol and citrate ligand binding, formation of sulfidic coatings, or the scavenging of peroxy-intermediates. Release can be accelerated by preoxidation or particle size reduction, while polymer coatings with complexation sites alter the release profile by storing and releasing inventories of surface-bound silver. Finally, the ability to tune biological activity is demonstrated through a bacterial inhibition zone assay carried out on selected formulations of controlled release nanosilver.


Figures

Figure 1
Figure 1
Examples of silver nano- and micro-structures of varying size and shape. (A) equi-axed particles physically deposited on titanium surface following colloidal synthesis, (B) Silver flakes nucleated on active sites along mechanically scratched Ti surface, (C) Higher magnification of silver flake cluster.
Figure 2
Figure 2
Equilibrium speciation and chemical pathways of silver in biological media. (A) Silver speciation as a function of total input chloride concentration with total input silver fixed at 1 mM. The red dashed curve gives total dissolved silver (Agdis), which passes through a minimum at 3 mM Cl. Gray dashed lines give typical chloride concentrations in environmental and biological scenarios: (a) groundwater; (b) surface freshwater; (c) mitochondria; (d) cytoplasm; (e) extracellular spaces; and (f) seawater. The shaded square gives typical total silver and chloride concentrations used in example biological studies on: (1) nitrifying bacteria; (2) E. coli; (3) primary human skin fibroblasts; (4) keratinocytes; (5) methicillin-resistant Staphylococcus aureus. It is clear that many biological studies take place in a supersaturated region where the primary equilibrium species is AgCl as a solid precipitate. (B) Silver speciation in thiol-containing saline at pH 7.4 and 1 mM total silver. The red Agdis curve represents all soluble silver species other than silver-thiol complexes. The gray dashed lines gives typical thiol concentrations in biological systems: (a) total glutathione in human blood plasma; (b) extracellular total thiol; (c) total glutathione in epithelial lining fluid in human lungs; (d) physiological cysteine in Gram-positive bacteria; (e) glutathione in lung epithelial cells; (f) intracellular total thiol. Silver thiol binding is very favorable, and above 0.2 mM thiol, the soluble silver fraction is dominated by Ag-thiol complexes. (C) Chemical pathways for nano-silver vs. conventional silver salts in biological systems based on calculations in A and B. Light blue shaded area represents biologically active, soluble Ag+ and AgClx1-x complexes. Silver salt addition to media (top) causes rapid precipitation of AgCl nanoparticles, which is a complicating factor in the interpretation of silver salt toxicity data. Nanoparticle precipitation will be followed by dynamic aggregation, settling, and cellular uptake, or even photoreductive processes that have not been properly defined or studied, but mediate the cellular response to silver salts. In contrast, metallic nanosilver addition (bottom) causes gradual ion release. The high affinity binding of Ag to thiols (Ka ~ 1012, or Kd ~ 10−12) causes direct thiol transfer at concentrations below the AgCl precipitation threshold. Thiol targets can be sufficiently abundant (typical intracellular total thiol concentration is 12 mM) to receive all of this silver, and thus avoid AgCl precipitation. The TEM shows AgCl nanoparticles that result from mixing equal amounts of 0.2 mM AgNO3 and NaCl solutions. Particle size distribution data is obtained by dynamic light scattering following adding of AgNO3 into saline (silver 0.1 mM).
Figure 3
Figure 3
Effect of particle size on silver release rates. (A) Typical TEM image of nAg-4.8 nm synthesized by reduction of AgClO4 with NaBH4 in presence of trisodium citrate, showing mono-dispersed spherical silver nanoparticles with an average diameter of 4.8±1.6 nm. (B) Typical TEM image of nAg-60 nm synthesized by reducing AgNO3 with trisodium citrate while boiling, showing pseudospherical and truncated triangular nanoparticles in a size range of 40~80 nm. (C) Image of a macroscopic square silver foil (4 mm × 4 mm × 0.127 mm). (D) Time-resolved mass-based soluble silver release measurements in air-saturated acetate buffer (pH 4). Initial concentrations of nAg-4.8 nm and nAg-60 nm are 0.05 mg/L, while initial concentration of silver foil is 10,700 mg/L (a 4 mm×4 mm×0.127 mm piece in 2 mL buffer). The release can be described by first order kinetics: − (dm/dt) = k · m, shown by dashed lines. (E) Surface area-based soluble silver release renormalized from (D).
Figure 4
Figure 4
Ion release control through surface modification. (A) Time-resolved silver ion release from modified nAg-4.8 nm suspensions. Purified nAg stock solution (40 mg/L) were treated with citrate, MUA or sodium sulfide and diluted to 2 mg/L for release kinetic measurements in air-saturated pH 5.6 acetate buffer in the dark at room temperature. (B) Cumulative silver ion release from modified silver foils. Release experiments were carried out in air-saturated pH 4 acetate buffer in the dark at room temperature (initial silver concentration: 10,700 mg/L). (C) Optical image of pristine and 0.1 mM Na2S-treated silver foil, showing scale formation. (D–F) SEM images of silver foil that is (D) pristine, (E) 0.1 mM Na2S modified, and (F) 100 mM Na2S modified. Scale bars are 200 nm.
Figure 5
Figure 5
Programmable two-stage ion release profiles following dry ozone treatment of nano-silver. (A) Time-resolved silver ion release from O3 oxidized nAg powder. Experiments were carried out in air-saturated pH 5.6 acetate buffer in the dark at room temperature (initial nAg suspension: 2 mg/L, as shown by the dash line). (B) Ion release measurements from nAg-4.8 nm impregnated glass microfiber filter papers pre-oxidized with O3 (2300 ppm, 1 L/min) for 0, 10 and 60 min. Experiments were carried out in air-saturated pH 5.6 acetate buffer in the dark at room temperature. Open squares represent the total silver (nAg particles and soluble forms) leaching from substrates, while the red crosses give only dissolved silver concentration (initial nAg concentration: 2 mg/L, as shown by the dash line). (C) TEM image and selected area diffraction pattern of nAg powder, showing nAg are polycrystalline with diameter of 20~40 nm. (D) X-ray diffraction spectrum of nAg powders that is (a) acetic acid washed (to remove any existing oxide); (b) pristine; (c) pre-oxidized (2300 ppm O3, 1 L/min, 8 hours) and (d) preoxidized (9400 ppm O3, 1 L/min, 18 hours), showing the peaks of silver decrease while the peaks of Ag2O and AgO increase after O3 treatment. All data for nAg powder samples from QuantumSphere® (CA, USA).
Figure 6
Figure 6
Control of silver ion release by manipulation of media composition. One day release data are gathered after incubation of nAg-4.8 nm in air-saturated modified acetate buffer media (pH 5.6) in the dark at room temperature for one day (initial nAg 2 mg/L). Upper dashed line represents the total silver concentration (2 mg/L), and the lower dashed line gives a typical 1-day silver ion release in acetate buffer (0.28 mg/L) with no additive.
Figure 7
Figure 7
Optical image of the results about the Kirby-Bauer antimicrobial susceptibility test applied to controlled-release nAg formulations (nAg-O3 for fast release; nAg-MUA for slow release) and controls. Silver-impregnated filter papers were placed on top of the E. coli inoculated agar plate and the image was taken after 18 hours incubation at 37 °C. Filter paper diameter is 10 mm.
Figure 8
Figure 8
Pictorial summary of chemical approaches to control the release of biologically active silver from nano-silver surfaces.
Figure 9
Figure 9
Unified comparison of ion release rate constants for a wide variety of modified nanoscale and macroscopic silver surfaces in this study. Open symbols: nanoparticles; solid symbols: foils. Release experiments in pH 4 acetate buffer (5 mM) at room temperature in dark (initial silver concentration for nAg samples is 0.05 mg/L and for silver foil samples is 10,700 mg/L). The unmodified silver samples from left to right are gum Arabic stabilized nAg (Strem Chemicals), gelatin stabilized nAg (Strem Chemicals), nAg-60 nm, nAg powder (QuantumSphere), nAg-4.8 nm, and silver foil (Strem Chemicals). Ion release rate can be described by − (dm/dt)t=0 = k ·A, integrated 0–12 h release data are used for rate constant calculation. Release rate constants can be varied over four orders of magnitude by the methods described here, especially ligand exchange, sulfide coating, and preoxidation. Asterisk indicates initial (1 hr) ion release rates because of the two-stage release behavior.

References

    1. Kim JS, Kuk E, Yu KN, Kim JH, Park SJ, Lee HJ, Kim SH, Park YK, Park YH, Hwang CY, et al. Antimicrobial Effects of Silver Nanoparticles. Nanomedicine: NBM. 2007;3:95–101. - PubMed
    1. Luoma SN. Silver Nanotechnologies and the Environment: Old problems or New Challenges? Washington, DC: Woodrow Wilson International Center for Schlars; 2008.
    1. Benn TM, Westerhoff P. Nanoparticle Silver Released into Water from Commercially Available Sock Fabrics. Environ. Sci. Technol. 2008;42:4133–4139. - PubMed
    1. Carlson C, Hussain SM, Schrand AM, Braydich-Stolle LK, Hess KL, Jones RL, Schlafer JJ. Unique Cellular Interaction of Silver Nanoparticles: Size-Dependent Generation of Reactive Oxygen Species. J. Phys. Chem. B. 2008;112:13608–13619. - PubMed
    1. Hussain SM, Schlager JJ. Safety Evaluation of Silver Nanoparticles: Inhalation Model for Chronic Exposure. Toxicol. Sci. 2009;108:223–224. - PubMed

Publication types