. 2010 Oct;128(4):1582-5.
doi: 10.1121/1.3466880.

Radiofrequency electrode vibration-induced shear wave imaging for tissue modulus estimation: a simulation study

Radiofrequency electrode vibration-induced shear wave imaging for tissue modulus estimation: a simulation study

Shyam Bharat et al. J Acoust Soc Am. 2010 Oct.

Abstract

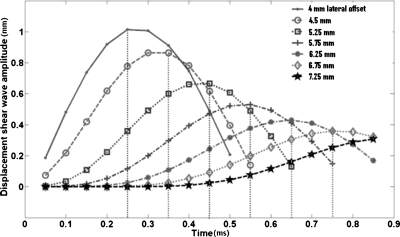
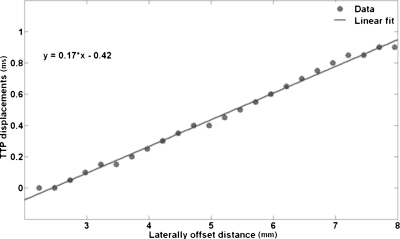
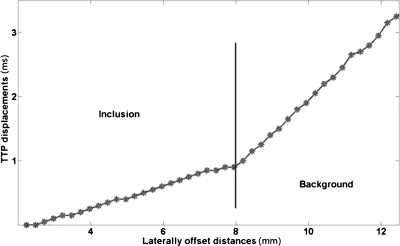
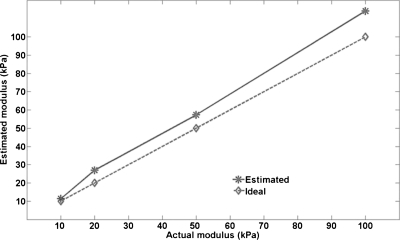
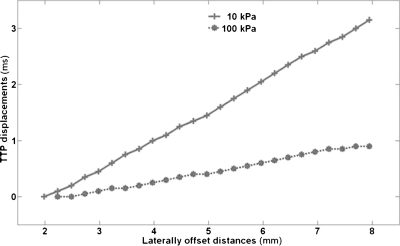
Quasi-static electrode displacement elastography, used for in-vivo imaging of radiofrequency ablation-induced lesions in abdominal organs such as the liver and kidney, is extended in this paper to dynamic vibrational perturbations of the ablation electrode. Propagation of the resulting shear waves into adjoining regions of tissue can be tracked and the shear wave velocity used to quantify the shear (and thereby Young's) modulus of tissue. The algorithm used utilizes the time-to-peak displacement data (obtained from finite element analyses) to calculate the speed of shear wave propagation in the material. The simulation results presented illustrate the feasibility of estimating the Young's modulus of tissue and is promising for characterizing the stiffness of radiofrequency-ablated thermal lesions and surrounding normal tissue.


Figures

Figure 1
Figure 1
Temporal progression of the shear wave at different positions in the model lateral to the ROE. Young’s modulus of inclusion is 100 kPa.
Figure 2
Figure 2
The TTP displacement of the shear wave at each pixel plotted against the lateral position of that pixel for inclusion modulus of 100 kPa. The inverse slope of this line corresponds to the velocity of the shear wave.
Figure 3
Figure 3
The change of slope in the TTP displacement line is indicative of the boundary between the inclusion and the background, i.e., a change in the Young’s modulus of the underlying propagation medium.
Figure 4
Figure 4
The estimated inclusion modulus for the different inclusion moduli simulated are plotted against the actual moduli. The bold line represents the estimated values while the dotted line represents the actual values. The deviation of the bold line from the dotted line indicates the errors in the estimation procedure.
Figure 5
Figure 5
The TTP displacement trend for image pixels laterally offset from the ROE. The bold curve represents the inclusion with Young’s modulus 10 kPa and the dotted curve represents the inclusion with Young’s modulus 100 kPa. This figure illustrates that shear wave propagation is faster when the underlying inclusion modulus is higher.

References

    1. Varghese T., “Quasi-static ultrasound elastography,” Ultrasound Clin. 4, 323–338 (2009).10.1016/j.cult.2009.10.009 - DOI - PMC - PubMed
    1. Varghese T., Zagzebski J. A., and Lee F. T., “Elastographic imaging of thermal lesions in the liver in vivo following radiofrequency ablation: Preliminary results,” Ultrasound Med. Biol. USMBA3 28, 1467–1473 (2002).10.1016/S0301-5629(02)00656-7 - DOI - PubMed
    1. Fahey B. J., Nelson R. C., Hsu S. J., Bradway D. P., Dumont D. M., and Trahey G. E., “In vivo guidance and assessment of liver radio-frequency ablation with acoustic radiation force elastography,” Ultrasound Med. Biol. USMBA3 34, 1590–1603 (2008).10.1016/j.ultrasmedbio.2008.03.006 - DOI - PMC - PubMed
    1. Hoyt K., Castaneda B., and Parker K. J., “Two-dimensional sonoelastographic shear velocity imaging,” Ultrasound Med. Biol. USMBA3 34, 276–288 (2008).10.1016/j.ultrasmedbio.2007.07.011 - DOI - PubMed
    1. Sandrin L., Tanter M., Gennisson J. L., Catheline S., and Fink M., “Shear elasticity probe for soft tissues with 1-D transient elastography,” IEEE Trans. Ultrason. Ferroelectr. Freq. Control ITUCER 49, 436–446 (2002).10.1109/58.996561 - DOI - PubMed

Publication types