Comparative Study
. 2010 Dec;115(6):1655-67.
doi: 10.1111/j.1471-4159.2010.07074.x. Epub 2010 Nov 19.

Constitutive phosphorylation by protein kinase C regulates D1 dopamine receptor signaling

Affiliations
Comparative Study

Constitutive phosphorylation by protein kinase C regulates D1 dopamine receptor signaling

Michele L Rankin et al. J Neurochem. 2010 Dec.

Abstract

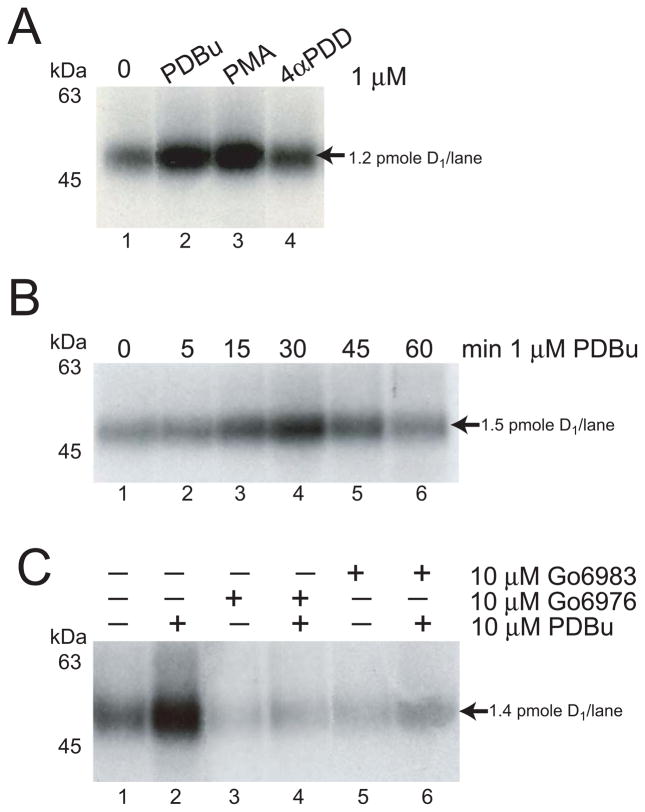
The D(1) dopamine receptor (D(1) DAR) is robustly phosphorylated by multiple protein kinases, yet the phosphorylation sites and functional consequences of these modifications are not fully understood. Here, we report that the D(1) DAR is phosphorylated by protein kinase C (PKC) in the absence of agonist stimulation. Phosphorylation of the D(1) DAR by PKC is constitutive in nature, can be induced by phorbol ester treatment or through activation of Gq-mediated signal transduction pathways, and is abolished by PKC inhibitors. We demonstrate that most, but not all, isoforms of PKC are capable of phosphorylating the receptor. To directly assess the functional role of PKC phosphorylation of the D(1) DAR, a site-directed mutagenesis approach was used to identify the PKC sites within the receptor. Five serine residues were found to mediate the PKC phosphorylation. Replacement of these residues had no effect on D(1) DAR expression or agonist-induced desensitization; however, G protein coupling and cAMP accumulation were significantly enhanced in PKC-null D(1) DAR. Thus, constitutive or heterologous PKC phosphorylation of the D(1) DAR dampens dopamine activation of the receptor, most likely occurring in a context-specific manner, mediated by the repertoire of PKC isozymes within the cell.


Figures

Figure 1
Figure 1. PKC phosphorylation of the D1DAR
In situ phosphorylation assays performed on HEK293T cells expressing the rat D1DAR as described in Materials and Methods. (A) Cells were treated for 30 min with 1 μM concentrations of PDBu (lane 2), PMA (lane 3), or 4αPDD (lane 4) prior to cell lysis. Lane 1 represents cells exposed to media alone. 1.2 pmoles of D1DAR were loaded into each lane. (B) Time course for PDBu-induced phosphorylation of the D1DAR. Cells were exposed to 1 μM PDBu for the times indicated prior to cell lysis and immunoprecipitation. 1.5 pmoles of D DAR were loaded into each lane. (C) (+) lanes indicate that the cells were exposed to the indicated chemicals, while (−) lanes indicate an absence of the indicated chemicals in the media. Cells were pretreated for 45 min with 10 μM Gö6976 or Gö6983 PKC inhibitors prior to stimulation with 10 μM PDBu for 30 min. 1.4 pmoles of D1DAR were loaded into each lane. This experiment was performed three times with similar results.
Figure 2
Figure 2. Activation of Gq-linked muscarinic receptors can lead to phosphorylation of the D1DAR
In situ phosphorylation assay performed on HEK293T cells cotransfected with the rat D1DAR and the mouse M1 mAchR (or empty vector) as described in Materials and Methods. (A) (+) lanes correspond to cells treated for 30 min with the 100 μM carbachol prior to cell lysis and immunoprecipitation. 1.2 pmoles of D1DAR were loaded into each lane. This experiment was performed three times with similar results. (B) The mean ± SEM of the normalized data collected from three individual experiments are reported in the histogram (ANOVA followed by Bonferroni pair-wise comparisons, where *p < 0.5).
Figure 3
Figure 3. Identification of individual PKC isozymes that can mediate D1DAR phosphorylation
(A) In situ phosphorylation assay performed on HEK293T cells expressing the D1DAR and empty vector (V) or PKCβI as described in Materials and Methods. (+) lanes correspond to cells treated for 30 min with the indicated PKC activator PDBu and/or the PKC inhibitors Gö6976 and Gö6983. The amount of D1DAR resolved for each lane is 0.5 pmole. Representative autoradiographs for D1DAR + PKCγ, δ, ε, μ, λ, and ζ co-expression experiments are presented in Supplementary Fig. 2. (B) Summary histogram of D1DAR + PKC isoform co-expression analysis. Co-expression of PKC βI, δ, ε, and γ (solid black bars indicated with an asterisk*) produce statistically greater phosphorylation of the D1DAR upon phorbol ester (PE) stimulation as compared to D1DAR + Vector stimulated with PE (checkered bar, second from left). The mean ± SEM of the normalized data collected from three to nine individual in situ phosphorylation assays performed as described in Fig. 3A are reported in the histogram, (ANOVA followed by Bonferroni pair-wise comparisons, where *p < 0.05).
Figure 4
Figure 4. Effect of PKC activation or inhibition on cAMP accumulation in cells expressing the D1DAR
Measurement of cAMP produced by HEK293T cells expressing the D1DAR receptor when exposed to the indicated stimuli as described in Materials and Methods. (A) Cells were pretreated for 30 min with 1 μM PMA or 1 hr with 3 μM Gö6983 prior to stimulation with the indicated concentrations of DA. EC50 values [mean (95% C.I.)] for each WT D1DAR sample are as follows: control = [7.6 × 10⁻⁸ M (4.6 × 10⁻⁸ to 1.3 × 10⁻⁷)], PMA = [1.4 × 10⁻⁷ M (9.2 × 10⁻⁸ to 2.2 × 10⁻⁷)], and Gö6983 = [1.1 × 10⁻⁷ M (7.6 × 10⁻⁸ to 1.6 × 10⁻⁷)]. (B) Summary histogram of EMAX cAMP (pmol/well) from cells treated as described above. Individual experimental data were divided by the EMAX obtained for WT control (untreated) group to take into account varying receptor expression levels between experiments. The mean ± SEM of the normalized data collected from six individual experiments are reported in the histogram (ANOVA followed by Bonferroni pair-wise comparisons, where *p < 0.5 and **p < 0.01).
Figure 5
Figure 5. Diagram of the rat D1DAR illustrating the constructs used in this study
All intracellular serine and threonine residues are indicated by shading. Truncation mutants are indicated in the figure at the point of STOP codon insertion and include T404, T394, T369, and T347. Site-specific mutants were created using site-directed mutagenesis to replace serine residues with alanine and threonine residues with valine and include “3rd TOTAL” where all serine and threonine residues are mutated in the third intracellular loop, “Tail TOTAL” where all serine and threonine residues are mutated in the carboxyl tail, “All TOTAL” which is a combination of 3rd TOTAL and Tail TOTAL. The “PKC-null” mutant lacks the five serine residues indicated by black circles (S259, S397, S398, S417, and S421).
Figure 6
Figure 6. Identification of PKC phosphorylation sites in the D1DAR
In situ phosphorylation assays performed on HEK293T cells expressing the indicated D1DAR constructs as described in Fig. 5 and Materials and Methods. (A and B) WT, truncation, and site-specific mutants of the D1DAR were stimulated with either DA or PDBu for 15 min prior to lysis, immunoprecipitation, resolution by SDS-PAGE, and autoradiography. In the figure labels, the pan mutants All TOTAL, 3rd TOTAL, and Tail TOTAL are abbreviated to “TOT.” (C) Reverse (Rev) constructs were created by site-directed mutagenesis using the Tail TOTAL as the template and reintroducing the indicated WT serine or threonine residues (numbering scheme for carboxyl serines and threonines is listed in Figure 5). Cells expressing the indicated reverse constructs were treated as described in A. (D) Cells expressing the D1DAR PKC-null construct were treated with control media or media supplemented with the PKC inhibitor Gö6983 for 45 min prior to stimulation with control, DA-, or PDBu-supplemented media for 15 min and processed as described in panels A–C. These experiments were performed three times with similar results.
Figure 7
Figure 7. Effect of PKC activation and inhibition on WT vs. PKC-null D1DAR cAMP accumulation
cAMP accumulation assays were performed on cells expressing the WT or PKC- null D1DAR. Cells were pretreated with 1 μM PMA for 30 min or 3 μM Gö6983 PKC inhibitor for 1 hr prior to stimulation with the indicated concentrations of DA for 20 min followed by cell lysis and cAMP quantitation. Representative cAMP accumulation assays performed on cells expressing similar levels (~4.5 pmoles/mg protein) of the (A) WT D1DAR, control EMAX = 21.9 pmoles cAMP/well; EC50 [mean (95% C.I.)] = [2.64 × 10⁻⁸ M (1.6 × 10⁻⁸ to 4.5 × 10⁻⁸)] or (B) PKC null, control EMAX = 33.4 pmoles cAMP/well; EC50 [mean (95% C.I.)] = [2.57 × 10⁻⁸ M (1.2 × 10⁻⁸ to 5.4 × 10⁻⁸)]. (C) Summary histogram of EMAX cAMP (pmoles/well) from cells treated as described above where PE represents “phorbol ester.” Each individual experiment was performed on cell samples expressing the same amount of WT or PKC-null receptor. Individual experimental data were divided by the EMAX obtained for WT control (untreated) group to take into account varying receptor expression levels between experiments. The mean ± SEM of the normalized data collected from five individual experiments are reported in the histogram (ANOVA followed by Bonferroni pair-wise comparisons, where *p < 0.5 and **p < 0.01; note that the WT D1DAR data is reiterated from Fig. 4B for comparative purposes.)
Figure 8
Figure 8. Removal of PKC phosphorylation sites within the D1DAR increases G protein-receptor coupling
[35S]GTPγS binding assay performed on cells expressing either the WT or PKC-null D1DAR and Gαs in a ratio of 5:1. (A) Representative binding experiment performed on cell membranes expressing 3.9 pmol/mg protein of either WT D1DAR (EMAX = 23.7 fmol/mg protein, [35S]GTPγS bound; EC50 [mean (95% C.I.)] = [1.61 × 10⁻⁷ M (6.9 × 10⁻⁸ to 3.8 × 10⁻⁷)] or PKC-null D1DAR (EMAX = 39.6 fmol/mg protein, [35S]GTPγS bound; EC50 [mean (95% C.I.)] = [1.37 × 10⁻⁷ M (4.3 × 10⁻⁸ to 4.4 × 10⁻⁷)] stimulated with the indicated concentrations of DA. (B) Summary histogram of BMAX (fmol/mg protein, [35S]GTPγS bound) from cells treated as described in A. Each individual experiment was performed on cell samples expressing the similar amounts of WT or PKC-null receptor. Data were divided by WT control BMAX for each individual experiment to take into account varying expression levels between experiments. The mean ± SEM of the normalized data collected from four individual experiments are reported in the histogram, where *p < 0.05 paired Student’s-t test.

References

    1. Bouvier M. Cross-talk between second messengers. Ann N Y Acad Sci. 1990;594:120–129. - PubMed
    1. Busillo JM, Armando S, Sengupta R, Meucci O, Bouvier M, Benovic JL. Site-specific phosphorylation of CXCR4 is dynamically regulated by multiple kinases and results in differential modulation of CXCR4 signaling. J Biol Chem. 2010;285:7805–7817. - PMC - PubMed
    1. Chen CH, Paing MM, Trejo J. Termination of protease-activated receptor-1 signaling by beta-arrestins is independent of receptor phosphorylation. J Biol Chem. 2004;279:10020–10031. - PubMed
    1. Ferguson SS. Evolving concepts in G protein-coupled receptor endocytosis: the role in receptor desensitization and signaling. Pharmacol Rev. 2001;53:1–24. - PubMed
    1. Fredriksson R, Schioth HB. The repertoire of G-protein-coupled receptors in fully sequenced genomes. Mol Pharmacol. 2005;67:1414–1425. - PubMed

Publication types