. 2010 Oct 22:10:108.
doi: 10.1186/1471-213X-10-108.

Postnatal development of depth-dependent collagen density in ovine articular cartilage

Affiliations

Postnatal development of depth-dependent collagen density in ovine articular cartilage

Mark C van Turnhout et al. BMC Dev Biol. .

Abstract

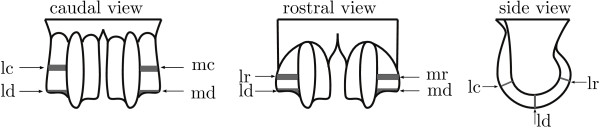
Background: Articular cartilage (AC) is the layer of tissue that covers the articulating ends of the bones in diarthrodial joints. Adult AC is characterised by a depth-dependent composition and structure of the extracellular matrix that results in depth-dependent mechanical properties, important for the functions of adult AC. Collagen is the most abundant solid component and it affects the mechanical behaviour of AC. The current objective is to quantify the postnatal development of depth-dependent collagen density in sheep (Ovis aries) AC between birth and maturity. We use Fourier transform infra-red micro-spectroscopy to investigate collagen density in 48 sheep divided over ten sample points between birth (stillborn) and maturity (72 weeks). In each animal, we investigate six anatomical sites (caudal, distal and rostral locations at the medial and lateral side of the joint) in the distal metacarpus of a fore leg and a hind leg.

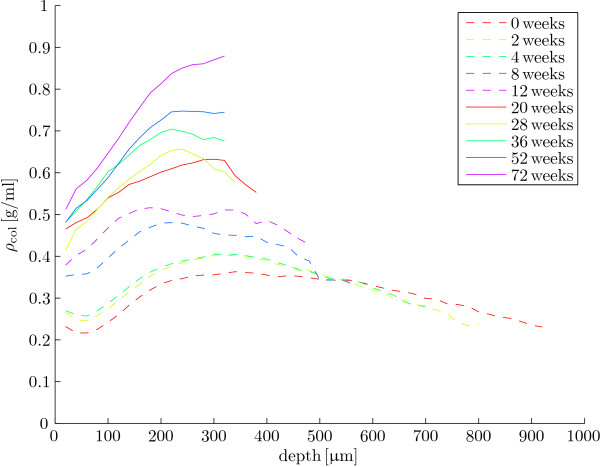
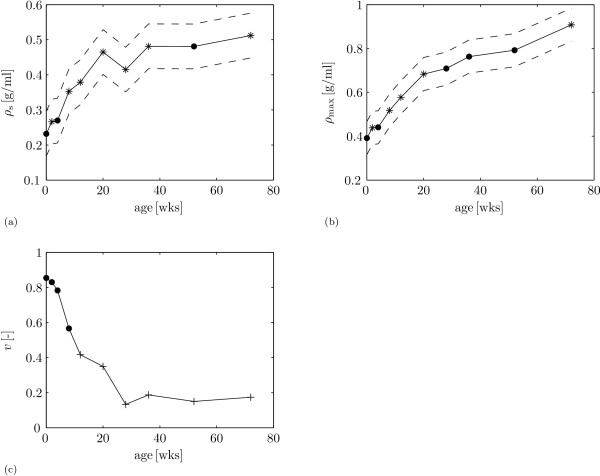
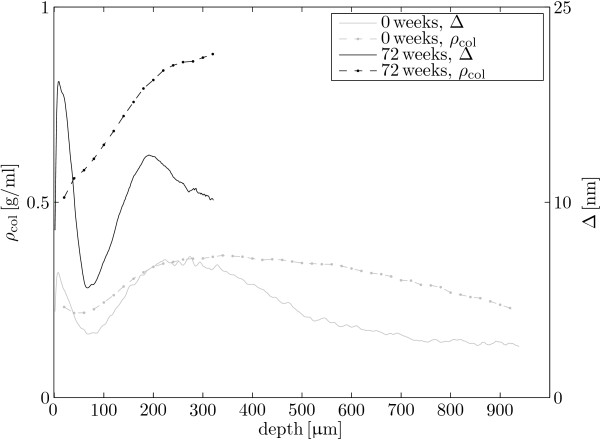
Results: Collagen density increases from birth to maturity up to our last sample point (72 weeks). Collagen density increases at the articular surface from 0.23 g/ml ± 0.06 g/ml (mean ± s.d., n = 48) at 0 weeks to 0.51 g/ml ± 0.10 g/ml (n = 46) at 72 weeks. Maximum collagen density in the deeper cartilage increases from 0.39 g/ml ± 0.08 g/ml (n = 48) at 0 weeks to 0.91 g/ml ± 0.13 g/ml (n = 46) at 72 weeks. Most collagen density profiles at 0 weeks (85%) show a valley, indicating a minimum, in collagen density near the articular surface. At 72 weeks, only 17% of the collagen density profiles show a valley in collagen density near the articular surface. The fraction of profiles with this valley stabilises at 36 weeks.

Conclusions: Collagen density in articular cartilage increases in postnatal life with depth-dependent variation, and does not stabilize up to 72 weeks, the last sample point in our study. We find strong evidence for a valley in collagen densities near the articular surface that is present in the youngest animals, but that has disappeared in the oldest animals. We discuss that the retardance valley (as seen with polarised light microscopy) in perinatal animals reflects a decrease in collagen density, as well as a decrease in collagen fibril anisotropy.


Figures

Figure 1
Figure 1
Sketch of sample sites. Sketch of the ovine distal metacarpus with the anatomical sampling sites with l - lateral, m - medial, c - caudal, d - distal, and r - rostral.
Figure 2
Figure 2
Example of FTIRμS analysis. Example of FTIRμS analysis. (a) The rectangular FOV of 160 × 40 μm2 is aligned with the articular surface, and next a linear profile perpendicular to the articular surface with 20 μm intervals is scanned. The depth of the measurement is measured from the articular surface to the centre of the FOV. The first scan is at depth d0 = 0 μm and only has AC for half of its FOV, the second scan is at d1 = 20 μm and measures the first 40 μm of the superficial layer, the third scan is at d2 = 40 μm and measures the FOV for 20 μm ≤ d ≤ 60 μm, etc. We do not present the results for the first scan at d0. (b) Example of FOV aligned with the articular surface at d0. (c) Example of a line scan with 20 μm intervals perpendicular to the articular surface. Crosses show the centre of the (aligned) FOV.
Figure 3
Figure 3
Example of FTIRμS spectra. Example of FTIRμS absorption (A) spectra. The vertical lines define the parts of the spectra that were used for the quantitative analysis, i.e. 700 cm-1 ν¯ ≤ 1710 cm-1. With (a) pure component spectra of the internal standard NaN3 (black), collagen (1.35 g/ml, dark gray) and chondroitin sulphate (3.19 g/ml, light gray); and (b) sample spectra from a single FOV at d = 100 μm for 0 weeks (gray) and 72 weeks (black).
Figure 4
Figure 4
Collagen density results per age. Mean collagen density as a function of cartilage depth for the ten ages.
Figure 5
Figure 5
Statistical results for collagen densities. Statistical results for collagen density profiles. With (a) mean collagen density at the surface ρs (solid) ± standard deviation (dashed) as a function of age. Stars mark values that are significantly different from the value at the previous age; (b) mean maximum collagen density ρmax (solid) ± standard deviation (dashed) as a function of age. Stars mark values that are significantly different from the value at the previous age; and (c) mean scores for the presence of the collagen density valley ν as a function of age. Crosses mark values that are significantly different from the value at 0 weeks.
Figure 6
Figure 6
Interpretation of retardance valley near the articular surface. Mean collagen densities (ρcol, dashed) for 0 weeks (gray) and 72 weeks (black) together with mean retardance results (Δ, solid) from our previous study [23]. The valley in collagen density can partly explain the retardation valley in the youngest animals, but not in the oldest animals.

References

    1. Venn M, Maroudas A. Chemical composition and swelling of normal and osteoarthrotic femoral head cartilage. I. Chemical composition. Annals of the Rheumatic Diseases. 1977;36(2):121–129. doi: 10.1136/ard.36.2.121. - DOI - PMC - PubMed
    1. Shapiro E, Borthakur A, Kaufman J, Leigh J, Reddy R. Water distribution patterns inside bovine articular cartilage as visualized by 1H magnetic resonance imaging. Osteoarthritis & Cartilage. 2001;9(6):533–538. - PubMed
    1. Mow VC, Guo XE. Mechano-electrochemical properties of articular cartilage: their inhomogeneities and anisotropies. Annual Review of Biomedical Engineering. 2002;4:175–209. doi: 10.1146/annurev.bioeng.4.110701.120309. - DOI - PubMed
    1. Benninghoff A. Form und Bau der Gelenkknorpel in ihren Beziehungen zur Funktion. Zweiter Teil: Der Aufbau des Gelenkknorpels in seinen Beziehungen zur Funktion. Zeitschrift für Zellforschung und Mikroskopische Anatomie. 1925;2:783–862. doi: 10.1007/BF00583443. - DOI
    1. Clark JM. Variation of collagen fiber alignment in a joint surface: a scanning electron microscope study of the tibial plateau in dog, rabbit, and man. Journal of Orthopaedic Research. 1991;9(2):246–257. doi: 10.1002/jor.1100090213. - DOI - PubMed

LinkOut - more resources