. 2010 Oct 22:4:141.
doi: 10.1186/1752-0509-4-141.

A multi-level study of recombinant Pichia pastoris in different oxygen conditions

Affiliations

A multi-level study of recombinant Pichia pastoris in different oxygen conditions

Kristin Baumann et al. BMC Syst Biol. .

Abstract

Background: Yeasts are attractive expression platforms for many recombinant proteins, and there is evidence for an important interrelation between the protein secretion machinery and environmental stresses. While adaptive responses to such stresses are extensively studied in Saccharomyces cerevisiae, little is known about their impact on the physiology of Pichia pastoris. We have recently reported a beneficial effect of hypoxia on recombinant Fab secretion in P. pastoris chemostat cultivations. As a consequence, a systems biology approach was used to comprehensively identify cellular adaptations to low oxygen availability and the additional burden of protein production. Gene expression profiling was combined with proteomic analyses and the 13C isotope labelling based experimental determination of metabolic fluxes in the central carbon metabolism.

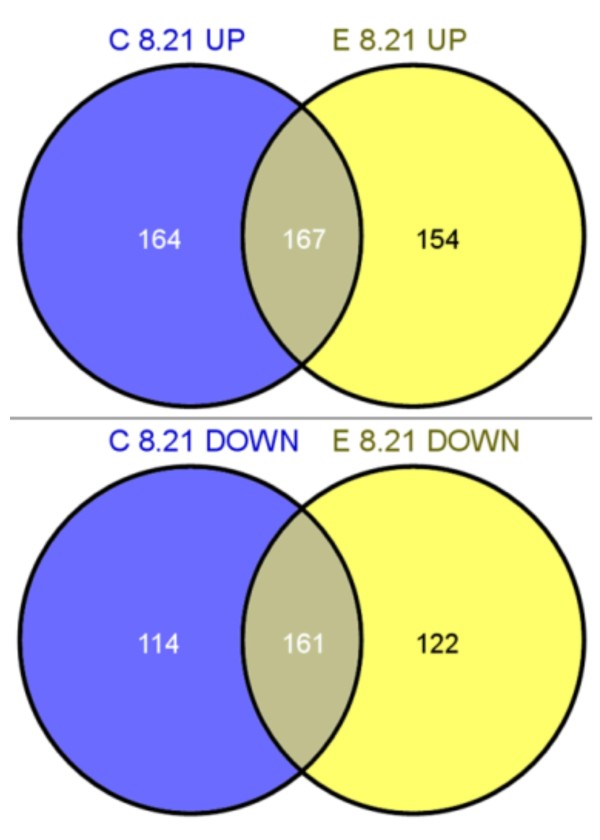
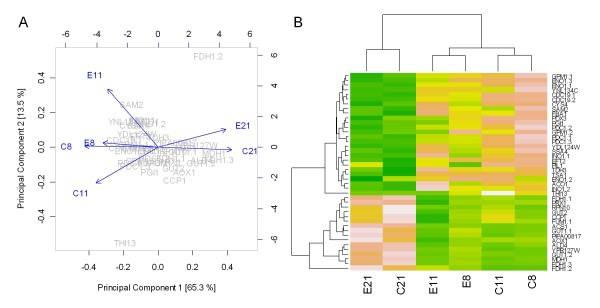
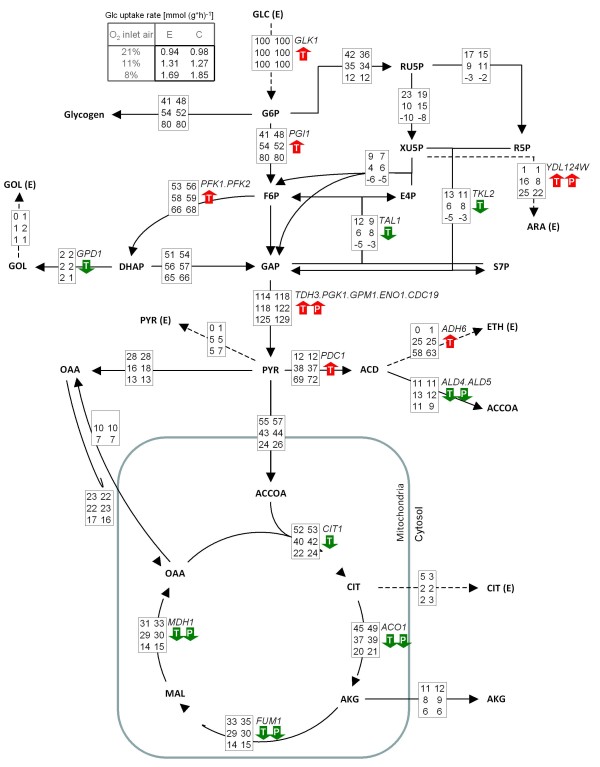
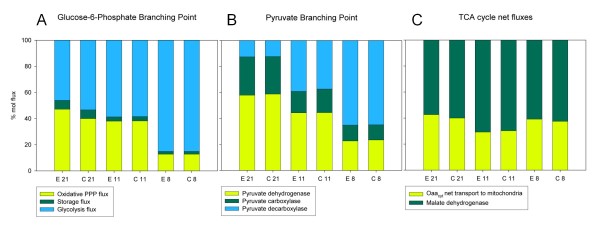
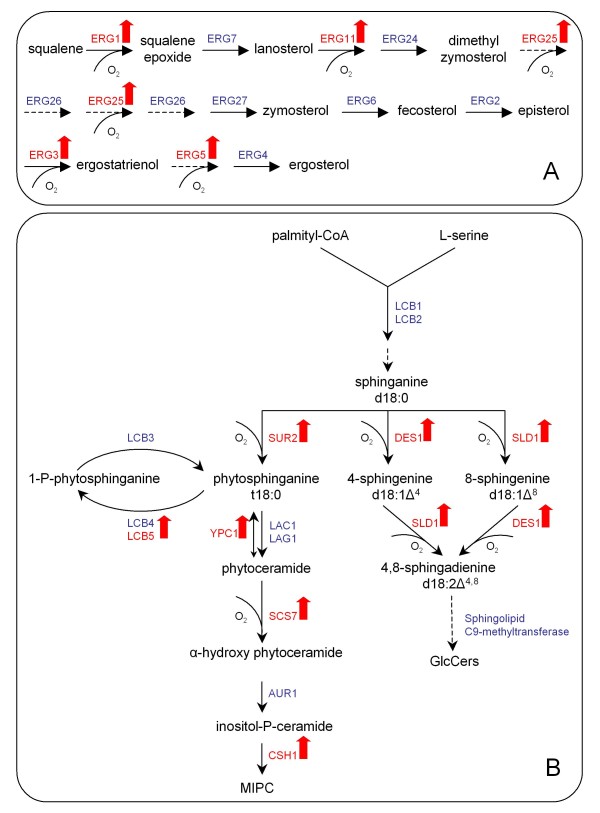
Results: The physiological adaptation of P. pastoris to hypoxia showed distinct traits in relation to the model yeast S. cerevisiae. There was a positive correlation between the transcriptomic, proteomic and metabolic fluxes adaptation of P. pastoris core metabolism to hypoxia, yielding clear evidence of a strong transcriptional regulation component of key pathways such as glycolysis, pentose phosphate pathway and TCA cycle. In addition, the adaptation to reduced oxygen revealed important changes in lipid metabolism, stress responses, as well as protein folding and trafficking.

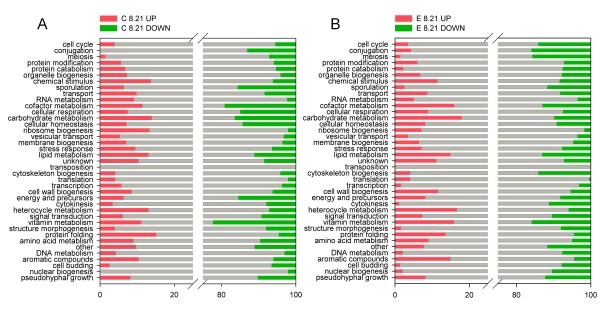
Conclusions: This systems level study helped to understand the physiological adaptations of cellular mechanisms to low oxygen availability in a recombinant P. pastoris strain. Remarkably, the integration of data from three different levels allowed for the identification of differences in the regulation of the core metabolism between P. pastoris and S. cerevisiae. Detailed comparative analysis of the transcriptomic data also led to new insights into the gene expression profiles of several cellular processes that are not only susceptible to low oxygen concentrations, but might also contribute to enhanced protein secretion.


Figures

Figure 1
Figure 1
Venn diagram. Venn diagram illustrating the relationship of up- and downregulated annotated genes (p ≤ 0.05, no log2 fold change) in the control (C) and expressing (E) strain in the pairwise comparison (8.21) of hypoxic (8) to normoxic (21) conditions. Up- or downregulation always refers to the lower oxygen setpoint, i.e. in this case to hypoxia. The intersections reflect equally regulated genes among both data sets.
Figure 2
Figure 2
Percentage distribution of regulated genes (cut-off p ≤ 0.05) to their respective GO biological process term(s). This graph provides an overview of the GO groups that strongly responded to hypoxia. The percentage of upregulated (red), downregulated (green) and unregulated genes (white) were classified into their GO functional group(s) and illustrated as relative numbers summing up 100%. A: control strain (C), B: expressing strain (E); 8.21 = pairwise comparison of hypoxic (8) and normoxic (21) conditions, with the type of regulation (UP or DOWN) referring to the hypoxic setpoint
Figure 3
Figure 3
Principal component analysis (PCA) and heat map of proteome data. A: Principal component analysis of the proteome data in a 2D graph of PC1 and PC2. The biplot shows proteome data (scores) as labelled dots and treatment effect (loadings) as vectors for the expressing (E) and control (C) strain) at different oxygen concentrations in the inlet gas (21, 11 or 8% O2). Vectors that are close together are highly correlated in terms of the observed proteome for each treatment while vectors that are orthogonal are poorly correlated. PC1 correlates well with the change in oxygen conditions as the projection of the tips of the arrows on PC1 axis indicate. The effect of the 8% conditions appears stronger than the effect of 11% and both effects clearly differ from the 21% reference on each strain as indicated by the projections. B: Heat map presentation of a hierarchical cluster of the 45 proteins that show significantly different (p ≤ 0.05) relative abundances in both strains (expressing (E) and control (C) strain) at different oxygen concentrations in the inlet gas (21, 11 or 8). The green colour represents low and pink colour represents high expression levels.
Figure 4
Figure 4
Metabolic flux distributions in P. pastoris Fab-expressing and control strains under different oxygenation conditions. Relative net flux distributions of P. pastoris X-33/pGAPαA_Fab and X-33/pGAPαA in glucose-limited chemostats at a D = 0.1 h-1 under different oxygenation conditions. Fluxes are shown as relative fluxes normalized to the specific glucose uptake rate (expressed as mmol glucose g-1 DCW h-1) in the corresponding experiment. The specific glucose uptake rates corresponding to the different oxygenation conditions and strains are given at the top of the figure. The fluxes for each reaction in the network corresponding to 21%, 11% and 8% oxygen in the bioreactor inlet gas are given from top to bottom; the flux values from the Fab-producing strain are shown on the left and those from the corresponding control strain on the right. The transport of Oaa across the mitochondrial membrane under normoxic conditions is given as a single net influx value. Fluxes with SD values are provided in the Additional file 5. Arrows indicate higher (red) or lower (green) mRNA levels (T) and protein abundances (P) during hypoxia compared to normoxia. The corresponding gene/protein names (in italics) are displayed above the arrows, while all metabolite names are indicated in bold letters: GLC = glucose; G6P = glucose-6-phosphate; F6P = fructose-6-phosphate; GAP = glyceraldehyde-3-phosphate; DHAP = dihydroxyacetone phosphate; GOL = glycerol; RU5P = ribulose-5-phosphate, XU5P = xylulose-5-phosphate; R5P = ribose-5-phosphate; ARA = arabitol; S7P = sedoheptulose-7-phosphate; PYR = pyruvate; ACD = acetaldehyde; ETH = ethanol; ACOOA = acetyl CoA; OAA = oxaloacetate; CIT = citrate; AKG = alpha-ketoglutarate; MAL = malate; (E) = external
Figure 5
Figure 5
Fractional distributions of carbon fluxes in metabolic branching points derived from 13C-MFA. Fractional distributions of carbon fluxes. A: the glucose-6-P flux split to glycolysis and PPP B: the pyruvate branching point, and C: the TCA cycle, in P. pastoris Fab-producing (E) and control (C) strains growing in glucose-limited chemostats at D = 0.1 h-1, in 21%, 11% and 8% oxygen in the chemostat inlet gas.
Figure 6
Figure 6
Scheme of pathways involved in lipid metabolism. Schematic overview of the discussed pathways involved in lipid metabolism. Colour code: red = upregulated genes; green = downregulated genes; and blue = un-regulated genes under hypoxic conditions (log2 fold change ≥ 0.59 and p ≤ 0.05) A: Sphingolipid metabolism in the yeast P. pastoris adapted from [51]. MIPC = mannosyl-inositol-phosphorylceramide, GlcCer = glucosylceramides B: Outline of the post-squalene ergosterol biosynthetic pathway, dashed arrows indicate no specification of intermediates

References

    1. Porro D, Mattanovich D. Recombinant protein production in yeasts. Methods Mol Biol. 2004;267:241–258. - PubMed
    1. Gasser B, Sauer M, Maurer M, Stadlmayr G, Mattanovich D. Transcriptomics-based identification of novel factors enhancing heterologous protein secretion in yeasts. Appl Environ Microbiol. 2007;73(20):6499–6507. doi: 10.1128/AEM.01196-07. - DOI - PMC - PubMed
    1. Bonander N, Bill R. Relieving the first bottleneck in the drug discovery pipeline: using array technologies to rationalize membrane protein production. Expert Rev Proteomics. 2009;6(5):501–505. doi: 10.1586/epr.09.65. - DOI - PubMed
    1. Mattanovich D, Gasser B, Hohenblum H, Sauer M. Stress in recombinant protein producing yeasts. J Biotechnol. 2004;113(1-3):121–135. doi: 10.1016/j.jbiotec.2004.04.035. - DOI - PubMed
    1. Knijnenburg T, Daran J, van den Broek M, Daran-Lapujade P, de Winde J, Pronk J, Reinders M, Wessels L. Combinatorial effects of environmental parameters on transcriptional regulation in Saccharomyces cerevisiae: a quantitative analysis of a compendium of chemostat-based transcriptome data. BMC Genomics. 2009;10:53. doi: 10.1186/1471-2164-10-53. - DOI - PMC - PubMed

Publication types

MeSH terms