. 2011 Jan 5;409(1):46-53.
doi: 10.1016/j.virol.2010.08.024.

Patients on HAART often have an excess of unintegrated HIV DNA: implications for monitoring reservoirs

Affiliations

Patients on HAART often have an excess of unintegrated HIV DNA: implications for monitoring reservoirs

Luis M Agosto et al. Virology. .

Abstract

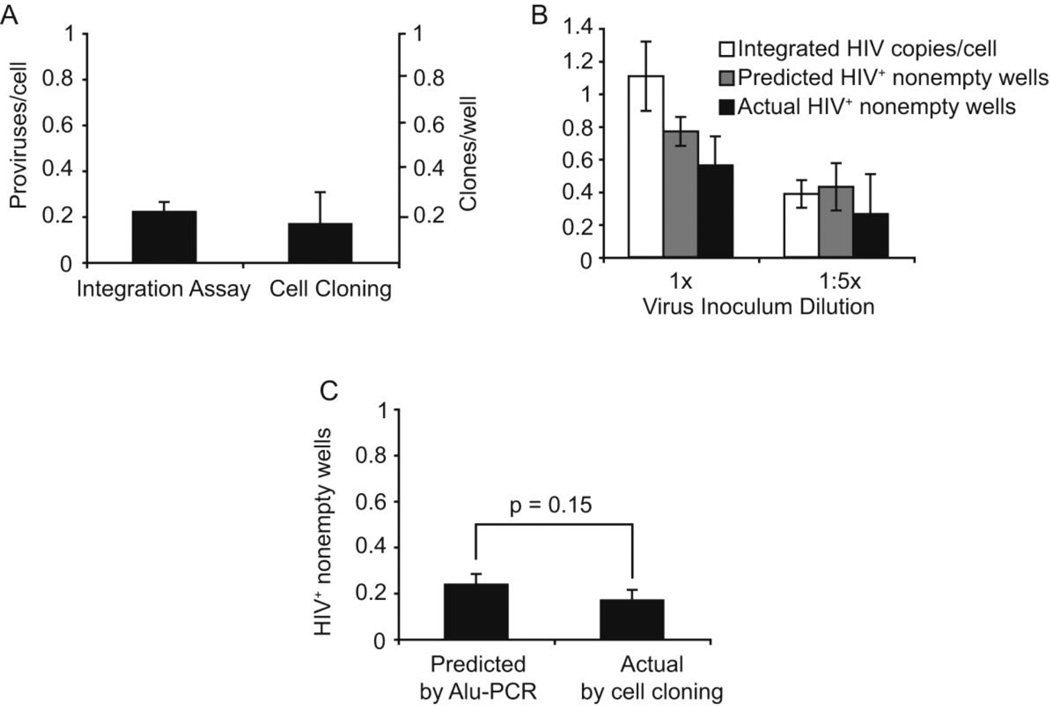
HIV establishes a latent reservoir early in infection that is resistant to anti-retroviral therapy and has a slow rate of decay. It is thought that the majority of HIV DNA in treated patients is integrated since unintegrated HIV DNA appears to be unstable. Thus, to monitor the HIV latent reservoir, total HIV DNA is commonly measured in PBMC from infected individuals. We investigated how often total approaches integrated HIV DNA in treated patients. To do this, we first assessed how accurate our integration assay is and determined the error in our measurements of total and integrated HIV DNA. We demonstrated an excess of total over integrated HIV DNA was present in a subset of patients, suggesting that measurements of total HIV DNA do not always correlate to the level of integration. Determining the cause of this excess and its frequency may have important implications for understanding HIV latent reservoir maintenance.


Figures

Figure 1
Figure 1. Overview of integration assay, lentiviral vector and complementary method to measure integration
(A) Nested Alu-PCR was used for measuring integration in samples of CEM-SS inoculated in vitro. The assay involves an initial endpoint PCR amplification of the region between gag and the nearest human Alu repeat, followed by a kinetic PCR amplification of the HIV-containing products of the first reaction. (B) The lentiviral vector used for our inoculations is the HIV-based lentiviral vector, VRX494 (Humeau et al., 2004; Lu et al., 2004). The primers used for PCR and their relative priming sites are outlined and described below the figure. (C) A complementary method to measure integration was performed by inoculating CEM-SS cells with VRX494 at 2 different viral dilutions. At 18hr post-inoculation the cells were separated into 2 aliquots: (i) measure integration by nested Alu-PCR and (ii) plated at 0.3 or 1 cell/well in round bottom 96-well plates until colonies grew. Colonies were isolated approximately 2 weeks later and tested for the presence of HIV DNA by late reverse transcription kinetic PCR.
Figure 2
Figure 2. Measuring HIV integration by Alu-PCR
CEM-SS cells were inoculated with two dilutions of VRX494 1× and 1:5× with or without integrase inhibitor from the beginning of the inoculation. HIV integration was measured by Alu-PCR at 0, 16, 18 and 24hr post-inoculation. (A, B) Sample PCR amplification plots of DNA from cells inoculated at 1× viral inoculum without (A) or with (B) integrase inhibitor at 18hr post-inoculation. Plots show that a signal is positive for integration when the amplification using primers for Alu-gag (gray lines) occurs at an earlier cycle threshold (Ct) than when using only the primer for gag (gag-only – black lines). The Alu-gag signal obtained with an integrase inhibitor gave a similar signal to the gag-only amplification. This confirms that the gag-only signal approximates the signal expected when there is no integration. (C, D) Integration time course in cells inoculated at 1× (C) and 1:5× (D) viral inoculum. Arrows indicate (a) the time point when integrase inhibitor was added to block further integration and (b) the time point when cells were collected to compare the level of integration measured by Alu-PCR and by single-cell cloning. Error bars indicate the standard deviation of the combined measurements of integration from 2 separate experiments. The dashed line indicates the limit of detection of integration. This limit is the average level of amplification obtained from the PCR negative control (gag-only reaction) of the integrase inhibitor inoculation control between 16 and 24hr post-inoculation.
Figure 3
Figure 3. Infection of CEM-SS with VRX494 or treatment with integrase inhibitor, minimally affects cloning efficiency
Cloning efficiency was determined by calculating the percentage of wells in which cell colonies grew with cloning at ~1 cell/well under the following conditions: viral inoculum with integrase inhibitor added at 16hr, uninfected without integrase inhibitor, uninfected with integrase inhibitor and infected without integrase inhibitor (1× viral dilution). Error bars represent the standard deviation of the combined data of 2 separate experiments.
Figure 4
Figure 4. The estimate of integration measured by nested Alu-PCR, closely correlates with the proportion of HIV-positive colonies obtained after single-cell cloning of infected CEM-SS cells
(A) Comparison of integration measured by Alu-PCR and by cell cloning when the cells were infected at low inoculum and single-cell cloned at 0.3 cells/well. (B) The level of integration detected by Alu-PCR was converted into an estimate of HIV-positive nonempty wells using the Poisson distibution formula (see Supplement). This corrects for multiply-infected cells and wells containing multiple clones at the time of cloning. The standard deviation for the Poisson-based estimate and the actual percent HIV-positive nonempty wells were calculated with the binomial distribution formula. (C) Comparison of predicted vs actual HIV positive nonempty wells. Graph represents the combination of values of (A) and (B) at each virus concentration after values were normalized to the level of late reverse transcription (SST) of each inoculation. p-values were calculated using Student’s T-test.
Figure 5
Figure 5. An excess of total DNA exists in a subset of patients receiving HAART
Total (SST) and integrated DNA were measured in PBMC samples from patients on HAART. The numbers above each black bar represents the ratio of total DNA over integrated DNA. The boxed numbers indicate measurements that show a true excess of unintegrated HIV DNA. These ratios are greater than 2.58 standard deviations above the integration standard ratio for a p > 0.01. We measured 15,000 genomes per well to measure integration (7,500 cell equivalents). We measured 0.2– 2 × 10⁶ cell equivalents for total, depending on sample availability. Error bars represent the standard deviation of 3 measurements of total DNA and 42 measurements of integrated DNA.

References

    1. Agosto LM, Yu JJ, Dai J, Kaletsky R, Monie D, O'Doherty U. HIV-1 integrates into resting CD4+ T cells even at low inoculums as demonstrated with an improved assay for HIV-1 integration. Virology. 2007;368(1):60–72. - PMC - PubMed
    1. Agosto LM, Yu JJ, Liszewski MK, Baytop C, Korokhov N, Humeau LM, O'Doherty U. The CXCR4-tropic human immunodeficiency virus envelope promotes more efficient gene delivery to resting CD4+ T cells than the vesicular stomatitis virus glycoprotein G envelope. J Virol. 2009;83(16):8153–8162. - PMC - PubMed
    1. Ansari-Lari MA, Donehower LA, Gibbs RA. Analysis of human immunodeficiency virus type 1 integrase mutants. Virology. 1995;211(1):332–335. - PubMed
    1. Archin NM, Keedy KS, Espeseth A, Dang H, Hazuda DJ, Margolis DM. Expression of latent human immunodeficiency type 1 is induced by novel and selective histone deacetylase inhibitors. AIDS. 2009;23(14):1799–1806. - PMC - PubMed
    1. Brussel A, Sonigo P. Analysis of early human immunodeficiency virus type 1 DNA synthesis by use of a new sensitive assay for quantifying integrated provirus. J Virol. 2003;77(18):10119–10124. - PMC - PubMed

Publication types