. 2011 Feb;272(1-2):135-47.
doi: 10.1016/j.heares.2010.10.007. Epub 2010 Oct 27.

Sound pressure transformations by the head and pinnae of the adult Chinchilla (Chinchilla lanigera)

Affiliations

Sound pressure transformations by the head and pinnae of the adult Chinchilla (Chinchilla lanigera)

Kanthaiah Koka et al. Hear Res. 2011 Feb.

Abstract

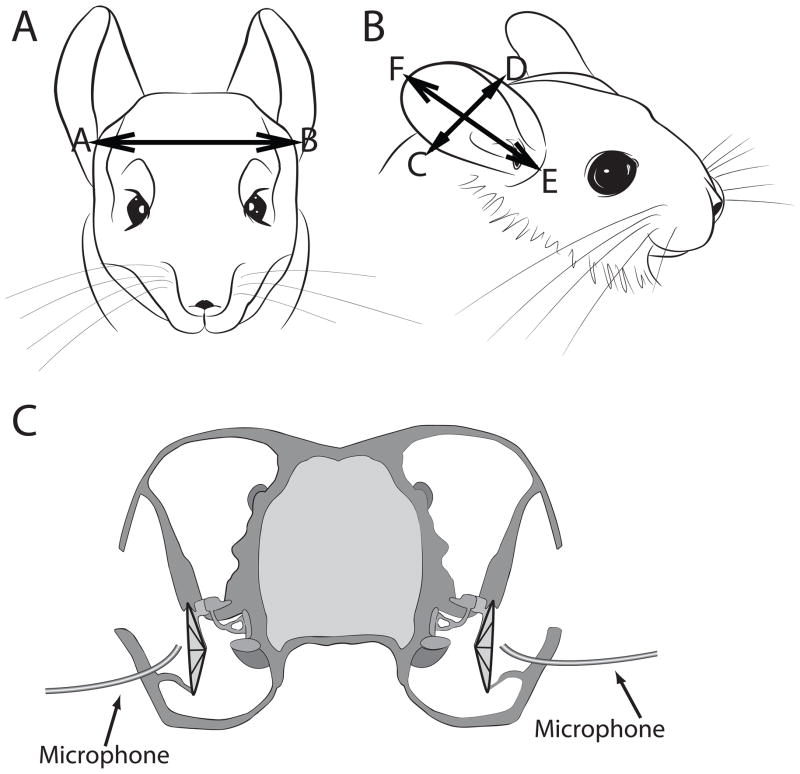
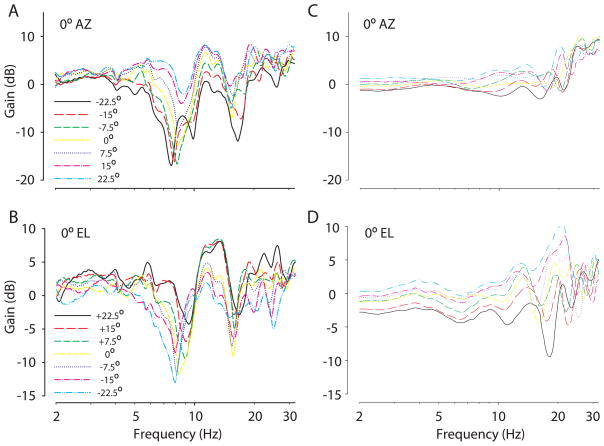
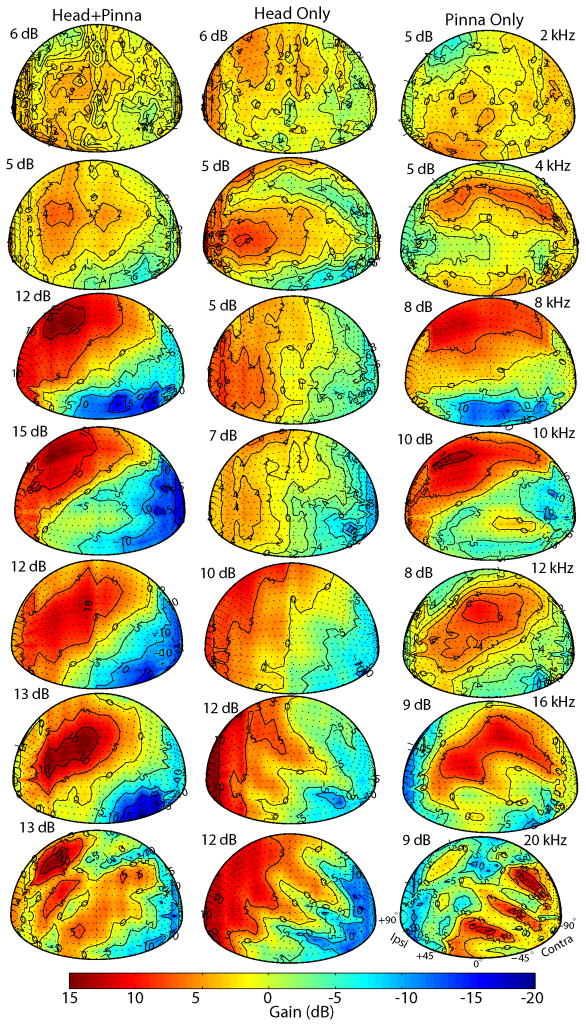
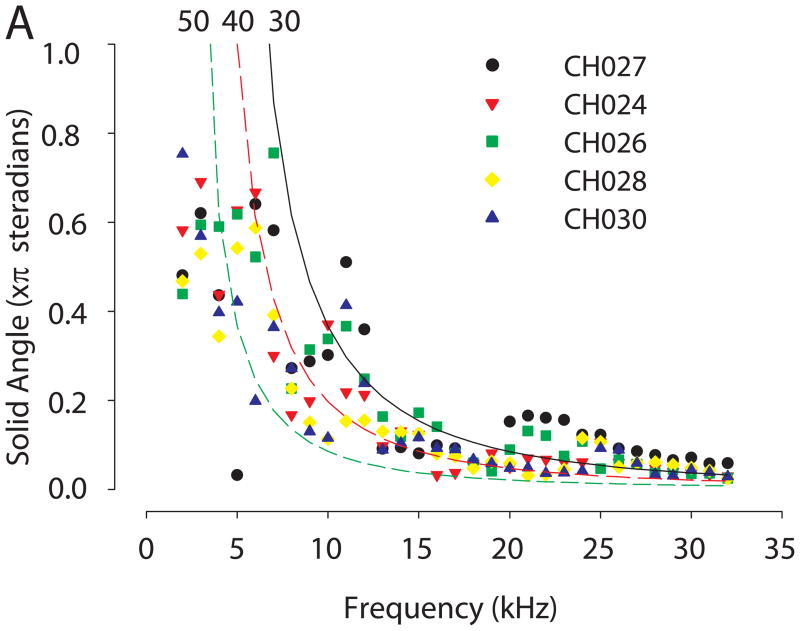
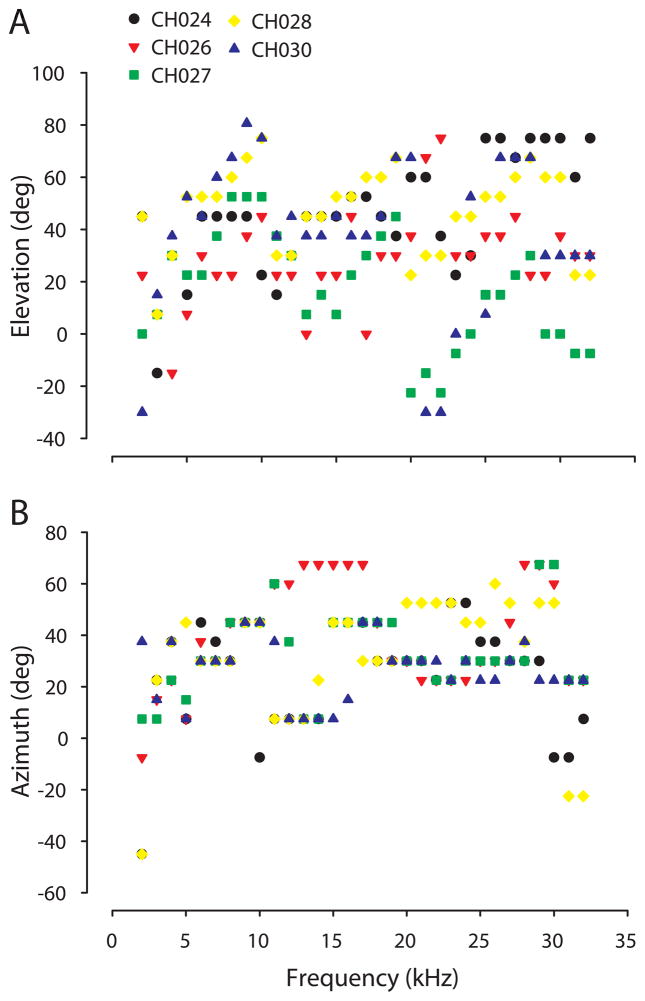
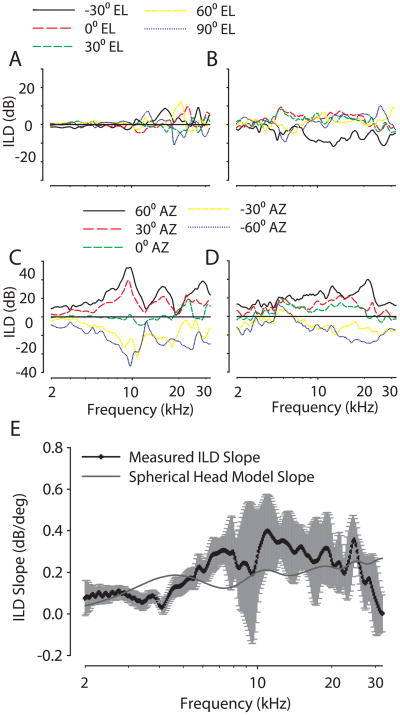
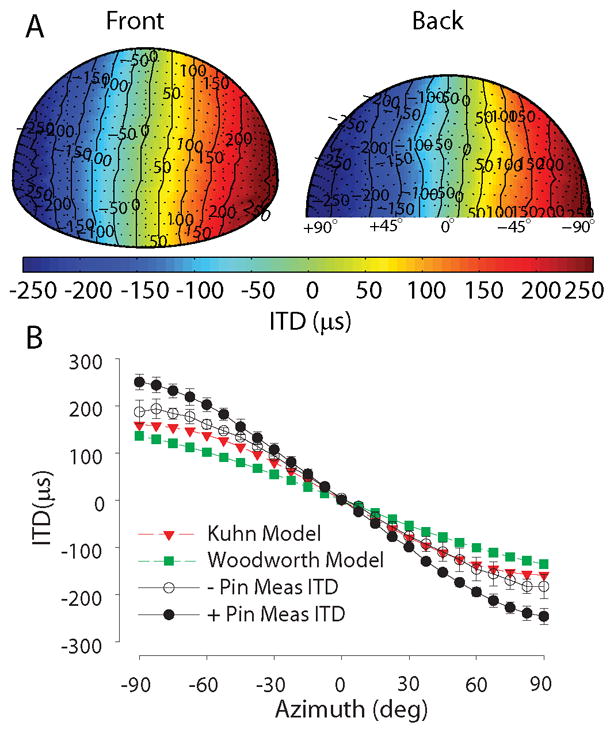
There are three main cues to sound location: the interaural differences in time (ITD) and level (ILD) as well as the monaural spectral shape cues. These cues are generated by the spatial- and frequency-dependent filtering of propagating sound waves by the head and external ears. Although the chinchilla has been used for decades to study the anatomy, physiology, and psychophysics of audition, including binaural and spatial hearing, little is actually known about the sound pressure transformations by the head and pinnae and the resulting sound localization cues available to them. Here, we measured the directional transfer functions (DTFs), the directional components of the head-related transfer functions, for 9 adult chinchillas. The resulting localization cues were computed from the DTFs. In the frontal hemisphere, spectral notch cues were present for frequencies from ∼6-18 kHz. In general, the frequency corresponding to the notch increased with increases in source elevation as well as in azimuth towards the ipsilateral ear. The ILDs demonstrated a strong correlation with source azimuth and frequency. The maximum ILDs were <10 dB for frequencies <5 kHz, and ranged from 10-30 dB for the frequencies >5 kHz. The maximum ITDs were dependent on frequency, yielding 236 μs at 4 kHz and 336 μs at 250 Hz. Removal of the pinnae eliminated the spectral notch cues, reduced the acoustic gain and the ILDs, altered the acoustic axis, and reduced the ITDs.


Figures

Figure 1
Figure 1
Head and pinnae dimensions of the adult chinchilla. In 9 animals, the average head diameter (AB) was 35.5 ±1.4 mm (Panel A), the average pinna width (CD) was 27.8 ±2.4 mm, and the average pinna length (EF) was 50 ±2.9 mm (Panel B). (C) Illustration of the placement of probe tube microphones in the lateral bony portion of the auditory canal. (Figure 1C is modified from Figure 1 of Koka et al., 2010).
Figure 2
Figure 2
Monaural broadband spectral shape cues. Plots of DTF gain for the right ear of one animal (CH07027) for elevations ranging from −22.5º to 22.5º in 7.5º steps for 0º azimuth (A) and for azimuths ranging from −22.5º to 22.5º in 7.5º steps for 0º elevation (B). The first spectral notch can be seen for frequencies ranging from ~6–10 kHz for these source locations. Plots of DTF gain for the same animal, but after the pinnae had been removed, for elevations ranging from −22.5º to 22.5º in 7.5º steps for 0º azimuth (C) and azimuths ranging from −22.5º to 22.5º in 7.5º steps for 0º elevation (D). Removal of the pinnae eliminates the deep spectral notch cues.
Figure 3
Figure 3
Spatial distribution of DTF gains for seven frequencies for the right ear (+90°, ipsilateral) of one animal (CH07030) for three different conditions: intact animal with head and pinna (“head+pinna”), head only after the pinna were removed (“head only”), and the contribution of the pinna (“pinna only”), which was computed as the difference of the “head+pinna” and “head only” measurements. The color bar indicates the gain in decibels.
Figure 4
Figure 4
Solid angle area (in units of π sr) enclosed by the −3 dB contour from the DTF gain plots (Figure 4) for 5 animals. Lines indicate the circular aperture model (see text) predicted dependence of the solid angle area on sound frequency for three different aperture diameters (i.e., effective pinnae diameters); these three aperture diameters (30, 40 and 50 mm) bracket the empirically measured pinnae sizes for the 5 animals shown (each symbol corresponds to data from a different animal).
Figure 5
Figure 5
The elevation (panel A) and azimuth (panel B) corresponding to the acoustic axis as a function of frequency in five animals; each symbol indicates data from a different animal. The acoustic axis is the spatial location corresponding to the maximum DTF gain (Figure 3) at a particular frequency.
Figure 6
Figure 6
(A) The ILD spectrum for one animal (CH07027). The ILD spectrum is the frequency-by-frequency difference between left- and right-ear DTFs at a given location. Positive ILD indicates higher gain at the left ear than the right ear. ILDs do not change much with changes in source elevation along the midsagittal plane (A), but change substantially with source azimuth along the horizontal plane (C). After both pinnae were removed, the ILD spectrum is similar for sources along the midsagittal plane (B), but ILDs are markedly reduced for sources varying along the horizontal plane (D). (E) The ILD-azimuth slope (dB/deg) for sources ±30° about the midline. The mean (thick black line) ILD-azimuth slope and associated 95% confidence interval (grey shaded area) is shown for 9 animals. The light grey line indicates the slope of the ILD based on the spherical head model of Duda and Martens (1998) with an adult head diameter as input.
Figure 7
Figure 7
Spatial distribution of ILD for seven frequencies for the right ear (+90° is ipsilateral) of one animal (CH07030) for three different conditions: intact animal with head and pinna (“head+pinna”), head only after the pinna were removed (“head only”), and the contribution of the pinna (“pinna only”) which was computed as the difference of the “head+pinna” and “head only” measurements. The color bar indicates the ILD in decibels.
Figure 8
Figure 8
(A) Spatial distribution of low frequency ITDs for one animal (CH07028) for locations in the frontal (left) and posterior (right) hemispheres. Positive ITDs indicate that the signal leads to the left ear. (B) The across-animal mean low frequency ITDs as a function of azimuth along the horizontal plane in two conditions: intact animal with pinnae (filled circle symbols, +pin, n = 9 animals) and after removal of both pinnae (open circle symbols, pin, n = 3 animals). The predicted ITDs based on an adult head diameter are also shown (closed squares, Woodworth (1938) model; closed triangles, Kuhn (1977) low–frequency ITD model).
Figure 9
Figure 9
The low-frequency ITDs as a function of azimuth along the horizontal plane measured with short-duration pure-tone stimuli for a single animal (CH07044). The predicted ITDs based on an adult head diameter are also shown (closed squares, Woodworth (1938) model; closed triangles, Kuhn (1977) low–frequency ITD model).

References

    1. Aytekin M, Grassi E, Sahota M, Moss CF. The bat head-related transfer function reveals binaural cues for sound localization in azimuth and elevation. J Acoust Soc Am. 2004;116:3594–3605. - PubMed
    1. Benson DA, Teas DC. Single unit of binaural interaction in the auditory cortex of the chinchilla. Brain Res. 1976;103:313–338. - PubMed
    1. Brand A, Behrend O, Marquardt T, McAlpine D, Grothe B. Precise inhibition is essential for microsecond interaural time difference coding. Nature. 2002;417:543–547. - PubMed
    1. Bugayevskiy LM, Snyder JP. Map Projections: A Reference Manual. Lomdon: Taylor and Francis; 1995.
    1. Calford MB, Pettigrew JD. Frequency dependence of directional amplification at the cat‘s pinna. Hear Res. 1984;14:13–19. - PubMed

Publication types