. 2011 Jan;46(1):308-17.
doi: 10.1016/j.mcn.2010.10.001. Epub 2010 Oct 21.

C. elegans multi-dendritic sensory neurons: morphology and function

Affiliations

C. elegans multi-dendritic sensory neurons: morphology and function

Adi Albeg et al. Mol Cell Neurosci. 2011 Jan.

Abstract

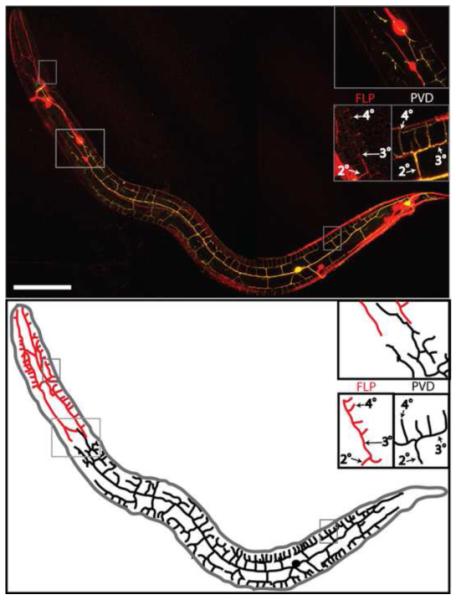
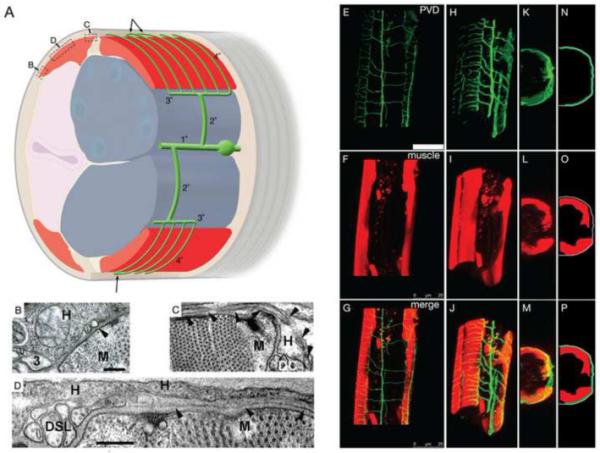
PVD and FLP sensory neurons envelope the body of the C. elegans adult with a highly branched network of thin sensory processes. Both PVD and FLP neurons are mechanosensors. PVD is known to mediate the response to high threshold mechanical stimuli. Thus PVD and FLP neurons are similar in both morphology and function to mammalian nociceptors. To better understand the function of these neurons we generated strains lacking them. Behavioral analysis shows that PVD and FLP regulate movement under normal growth conditions, as animals lacking these neurons demonstrate higher dwelling behavior. In addition, PVD--whose thin branches project across the body-wall muscles--may have a role in proprioception, as ablation of PVD leads to defective posture. Moreover, movement-dependent calcium transients are seen in PVD, a response that requires MEC-10, a subunit of the mechanosensory DEG/ENaC channel that is also required for maintaining wild-type posture. Hence, PVD senses both noxious and innocuous signals to regulate C. elegans behavior, and thus combines the functions of multiple mammalian somatosensory neurons. Finally, strong mechanical stimulation leads to inhibition of egg-laying, and this response also depends on PVD and FLP neurons. Based on all these results we suggest that noxious signals perceived by PVD and FLP promote an escape behavior consisting of increased speed, reduced pauses and reversals, and inhibition of egg-laying.


Figures

Figure 1
Figure 1. PVD and FLP branches envelop the nematode’s body
Above, confocal reconstruction of an animal expressing F49H12.4:GFP (yellow) and mec-7:RFP (red). Insets show a representative candelabra-like branching pattern of FLP (head), PVD (body), and a region where PVD and FLP branches meet but do not overlap. Indicated are branch names (2°, 3°, 4°) given according to the order of appearance in development. Below is a line diagram showing PVD (black) and FLP (red) branches. Only processes belonging to either PVD or FLP are shown in this drawing; processes of other neurons expressing either of the two reporters are omitted. Scale bar is 25 um.
Figure 2
Figure 2. PVD branches extend between muscle and the hypodermis
(A) Cartoon (oblique lateral view) shows the relative positions of the lateral PVD cell body and branches (green), the 1° process, two 2° processes, two 3° processes at the lateral margin of dorsal or ventral muscle quadrants (red), and many fine branches (4° processes) passing between the body-wall muscle (red) and the outer hypodermis (pale brown, most hypodermis has been cut away to view beneath it). Tiling of consecutive 4° branches while crossing the muscle quadrant is shown and occasional fusions of their terminal ends with neighboring 4° branches is indicated by arrows. Gonad, blue; Intestine, pale pink; Cuticle, grey. The relative length of 4° branches is exaggerated in this cartoon for the sake of clarity. Boxes indicate position of TEM images B, C, and D relative to muscle. (B) Transverse TEM image shows a presumptive 3° PVD branch (3), embedded in the lateral hypodermis (H) at the lateral edge of a dorsal body-wall muscle (M), and a much smaller presumptive 4° branch (arrowhead) seen in cross-section before moving beneath the muscle (animal N501C from the Hall archive). (C) Transverse TEM image of a PVD 4° branch (arrowheads) running laterally across the muscle, and then emerging medially, adjacent to the dorsal nerve cord (DC) (animal N2U, MRC archive). Note the much larger diameter of the dorsal cord axons, sublateral nerve axons, and 3° PVD process compared to PVD 4°. Scale bar indicates 200 nm for panels B, C. (D) Transverse TEM image of a PVD 4° branch (arrowheads) running laterally across the muscle quadrant near the dorsal sublateral nerve (DSL) (animal N501A from the Hall archive). Scale bar 200 nm. (E-P) 3-D reconstructions and projections of PVD in green (F49H12.4:GFP in E H, K, N), muscles in red (myo-3:dsRed2 in F, I, L, O) and merged images (G, J, M, P). Rotated confocal images (H-M) and schematic tracings (N-P) show PVD branches (green) extending over the body-wall muscle quadrants (red) and beneath the outer hypodermal layer (grey). Scale bar indicates 25 um (E-G).
Figure 3
Figure 3. Movement analysis in mutants defective for PVD and FLP
Movement was analyzed from movies of single adults from the following strains: N2 (n=34), −T (n=26), −P (n=21), −TP (n=24), −TPF (n=30), mec-3 (n=19), and mec-10 (n=18). Significant differences relative to N2 (or relative to −T in C) are indicated by a single asterisk (P<0.05) or a double asterisk (p<0.01). (A) Speed (mm/sec). Additional significant differences are: −T and mec-10 relative to -TP, -TPF and mec-3 (p<0.01) or to −P (p<0.05). (B) Number of pauses per frame. Additional significant differences are: −T and mec-10 relative to −TPF and mec-3 (p<0.01) (C) Number of reversals per frame. (D) Displacement in mm/second. Additional significant differences are: −T, -P and −TP relative to −TPF and mec-3 (p<0.01) and for mec-10 relative to −TPF and mec-3 (p<0.01). (E) Representative tracings of a single animals’ movement in one movie (superimposed pictures of all the frames of a movie). Movies are taken at a rate of 10 frames per sec. Scale bar 1mm.
Figure 4
Figure 4. Postural defects in animals lacking PVD
Analysis of N2 (n=34), −P (n=21), and mec-10 (n=18). Significant differences relative to N2 are indicated by a double asterisk (P<0.01). (A) Diagrammatic representation of parameters used for postural analysis. Circles surround cut-points between the central body axis or “skeleton” and a straight line connecting the head and tail. (B) Average bending angle. (C) Cut-point number. (D) Average amplitude. For each animal the amplitude is divided by the length in mm. (E) Representative tracks of animals from the different strains. Scale bar 1mm.
Figure 5
Figure 5. Calcium imaging of PVD during movement
(A) A worm with its tail glued to the substrate as shown in the schematic is able to bend anterior regions of the body. (B-E) Body-bending evokes Ca2+ transients in PVD. Shown are sample traces from different wild-type worms. The red trace represents the percentage change in the YFP/CFP ratio, R/R0. The scale bar represents a ratio change of 20% and a time interval of 20 seconds. Black arrows indicate the onset of a series of bending movements. (F) Worms glued along the length of the body were unable to bend and no Ca2+ transients were detected. The red trace represents the average R/R0 and gray shading indicates SEM. This trace represents the average of 11 animals. (G) mec-10(lf) animals glued at the tail. The red trace represents the average R/R0 and gray shading indicates SEM. This trace represents the average of 10 animals. (H) Scatter plot of R/R0 for fully restrained and partially restrained animals (R0 is the lowest point at the start of a transient and R is the peak value, a value of zero was assigned to traces having no transients). In traces where several transients were shown we calculated the average of all transients. The mean is shown as a red square. Error bars indicate SEM. Also shown are individual data points for each condition (26 partly restrained wild-type (40 transients analyzed), 11 immobilized wild-type, and 10 partly restrained mec10(tm1552) animals).
Figure 6
Figure 6. FLP side branches appear late in development
Z-stacked images of DEG-3 staining from synchronized N2 animals. (A) Second larval stage, PVD is not seen. Indicated is the ALM neuron. (B) Third larval stage. Indicated are representative 2° branches belonging to PVD (empty arrow heads) and FLP (filled arrow head). (C) Late fourth larval stage. Indicated are representative 4° branches belonging to PVD (Empty arrow head) and FLP (Filled arrow head). (D) Single section from the same animal as in C, showing only the major FLP branches (filled arrow heads). Scale bar 0.01/mm for A-D.
Figure 7
Figure 7. Inhibition of egg-laying by noxious mechanical stimuli
Number of eggs-laid in the first half hour following transfer with a wire pick divided by average number of eggs laid by the same strain per half an hour, in N2, −T, −P, −TP, and −TPF, n=29-33 each. Significant differences relative to N2 are indicated by a double asterisk (P<0.01). −TPF is also different from −T, (p<0.01).

References

    1. Caterina MJ, Julius D. Sense and specificity: a molecular identity for nociceptors. Curr. Opin. Neurobiol. 1999;9:525–530. - PubMed
    1. Chalfie M, Sulston J. Developmental Genetics of the mechanosensory neurons of Caenorhabditis elegans. Dev. Biol. 1981;82:358–370. - PubMed
    1. Chatzigeorgiou M, Yoo S, Watson JD, Lee W-H, Spencer WC, Kindt KS, Hwa SW, D. M. Miller I, Treinin M, Driscoll M, Schafer WR. Specific roles for DEG/ENaC and TRP channels in mechanical and thermal sensation in C. elegans polymodal nociceptors. Nat. Neurosci. 2010 In press. - PMC - PubMed
    1. Driscoll M, Chalfie M. The mec-4 gene is a member of a family of Caenorhabditis elegans genes that can mutate to induce neuronal degeneration. Nature. 1991;349:588–593. - PubMed
    1. Fire A, Waterston RH. Proper expression of myosin genes in transgenic nematodes. EMBO J. 1989;8:3419–3428. - PMC - PubMed

Publication types

MeSH terms