. 2011 Jan;300(1):L25-31.
doi: 10.1152/ajplung.00256.2010. Epub 2010 Oct 22.

The air-liquid interface and use of primary cell cultures are important to recapitulate the transcriptional profile of in vivo airway epithelia

Affiliations

The air-liquid interface and use of primary cell cultures are important to recapitulate the transcriptional profile of in vivo airway epithelia

Alejandro A Pezzulo et al. Am J Physiol Lung Cell Mol Physiol. 2011 Jan.

Abstract

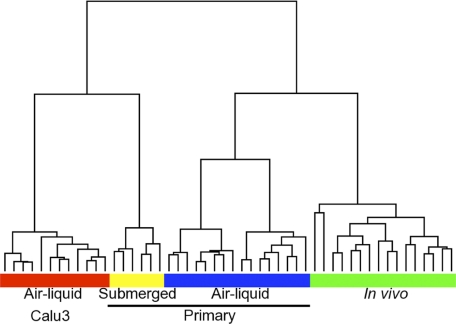
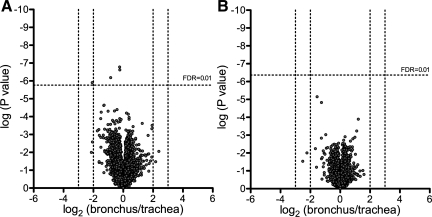
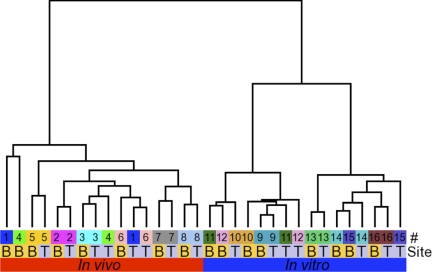
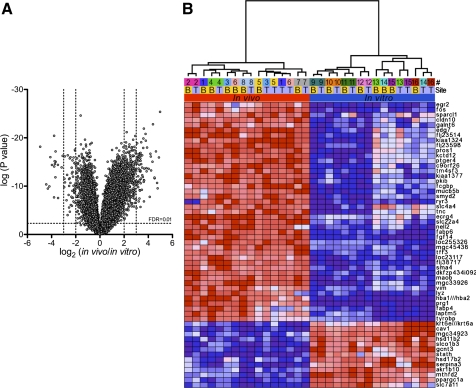
Organotypic cultures of primary human airway epithelial cells have been used to investigate the morphology, ion and fluid transport, innate immunity, transcytosis, infection, inflammation, signaling, cilia, and repair functions of this complex tissue. However, we do not know how closely these cultures resemble the airway surface epithelium in vivo. In this study, we examined the genome-wide expression profile of tracheal and bronchial human airway epithelia in vivo and compared it with the expression profile of primary cultures of human airway epithelia grown at the air-liquid interface. For comparison, we also investigated the expression profile of Calu-3 cells grown at the air-liquid interface and primary cultures of human airway epithelia submerged in nutrient media. We found that the transcriptional profile of differentiated primary cultures grown at the air-liquid interface most closely resembles that of in vivo airway epithelia, suggesting that the use of primary cultures and the presence of an air-liquid interface are important to recapitulate airway epithelia biology. We describe a high level of similarity between cells of tracheal and bronchial origin within and between different human donors, which suggests a very robust expression profile that is specific to airway cells.


Figures

Fig. 1.
Fig. 1.
Unsupervised hierarchical clustering of airway epithelial cells. RNA was extracted from samples of Calu-3 cells (n = 12; red box), in vitro airway epithelia submerged in nutrient media (n = 6; yellow box), in vitro differentiated airway epithelia (n = 16; blue box), and in vivo airway epithelia (n = 16; green box). Biotinylated cRNA was synthesized following the manufacturer's protocol and then hybridized to a custom GeneChip Human Airway Array (HsAirway; Affymetrix). Normalized data were analyzed in GenePattern (http://www.broadinstitute.org/cancer/software/genepattern/) using the “HierarchicalClustering” module with Pearson correlation as distance measure and pairwise complete linkage as clustering method.
Fig. 2.
Fig. 2.
One-way ANOVA comparing tissue from bronchus and trachea. Normalized microarray expression data from tracheal and bronchial samples of in vivo airway epithelia (A) and in vitro differentiated airway epithelia (B) were analyzed using 1-way ANOVA. Average probe fold change levels between bronchial and tracheal samples with their respective P values are displayed as volcano plots. FDR, false discovery rate.
Fig. 3.
Fig. 3.
Unsupervised hierarchical clustering of in vivo airway epithelia and in vitro differentiated airway epithelia. Normalized microarray expression data from in vitro differentiated airway epithelia (n = 16; blue box) and in vivo airway epithelia (n = 16; red box) were analyzed in GenePattern using the HierarchicalClustering module with Pearson correlation as distance measure and pairwise complete linkage as clustering method. Labels denote donor (#) and tracheal (T) or bronchial (B) source of tissue.
Fig. 4.
Fig. 4.
ANOVA for expression data from in vivo airway epithelia and in vitro differentiated airway epithelia. A: normalized microarray expression data from samples of in vivo airway epithelia and in vitro differentiated airway epithelia were analyzed using 1-way ANOVA. Average probe fold change levels between in vitro and in vivo samples with their respective P values are displayed as a volcano plot. Genes differentially expressed at a log2 fold change level > 3 with an FDR < 1% are displayed as a heat map in B. Labels denote donor (#) and tracheal (T) or bronchial (B) source of tissue.

Similar articles

Cited by

References

    1. Banerjee B, Kicic A, Musk M, Sutanto EN, Stick SM, Chambers DC. Successful establishment of primary small airway cell cultures in human lung transplantation. Respir Res 10: 99, 2009 - PMC - PubMed
    1. Brunskill EW, Aronow BJ, Georgas K, Rumballe B, Valerius MT, Aronow J, Kaimal V, Jegga AG, Yu J, Grimmond S, McMahon AP, Patterson LT, Little MH, Potter SS. Atlas of gene expression in the developing kidney at microanatomic resolution. Dev Cell 15: 781–791, 2008 - PMC - PubMed
    1. Carolan BJ, Harvey BG, Hackett NR, O'Connor TP, Cassano PA, Crystal RG. Disparate oxidant gene expression of airway epithelium compared to alveolar macrophages in smokers. Respir Res 10: 111, 2009 - PMC - PubMed
    1. Clarke S, Gordon S. Myeloid-specific gene expression. J Leukoc Biol 63: 153–168, 1998 - PubMed
    1. Dajani R, Zhang Y, Taft PJ, Travis SM, Starner TD, Olsen A, Zabner J, Welsh MJ, Engelhardt JF. Lysozyme secretion by submucosal glands protects the airway from bacterial infection. Am J Respir Cell Mol Biol 32: 548–552, 2005 - PMC - PubMed

Publication types