. 2011 Feb 4;286(5):3693-706.
doi: 10.1074/jbc.M110.135244. Epub 2010 Oct 22.

Amyloid-beta protein oligomer at low nanomolar concentrations activates microglia and induces microglial neurotoxicity

Affiliations

Amyloid-beta protein oligomer at low nanomolar concentrations activates microglia and induces microglial neurotoxicity

Izumi Maezawa et al. J Biol Chem. .

Abstract

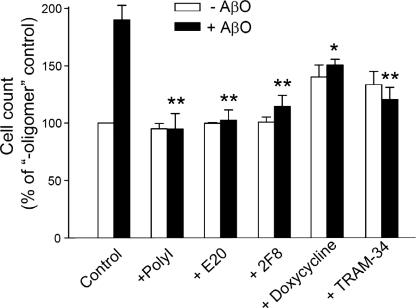
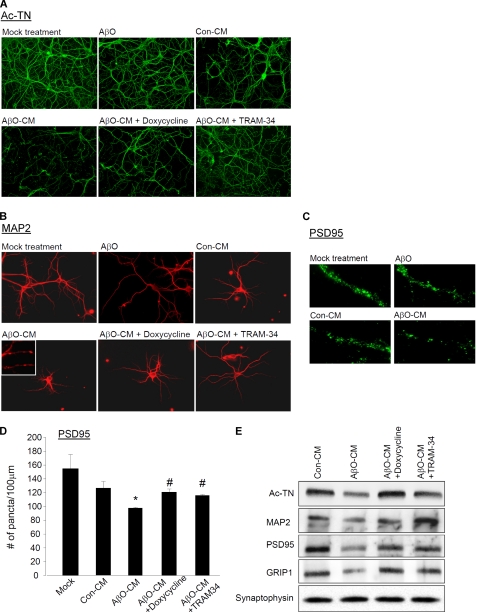
Neuroinflammation and associated neuronal dysfunction mediated by activated microglia play an important role in the pathogenesis of Alzheimer disease (AD). Microglia are activated by aggregated forms of amyloid-β protein (Aβ), usually demonstrated in vitro by stimulating microglia with micromolar concentrations of fibrillar Aβ, a major component of amyloid plaques in AD brains. Here we report that amyloid-β oligomer (AβO), at 5-50 nm, induces a unique pattern of microglia activation that requires the activity of the scavenger receptor A and the Ca(2+)-activated potassium channel KCa3.1. AβO treatment induced an activated morphological and biochemical profile of microglia, including activation of p38 MAPK and nuclear factor κB. Interestingly, although increasing nitric oxide (NO) production, AβO did not increase several proinflammatory mediators commonly induced by lipopolyliposaccharides or fibrillar Aβ, suggesting that AβO stimulates both common and divergent pathways of microglia activation. AβO at low nanomolar concentrations, although not neurotoxic, induced indirect, microglia-mediated damage to neurons in dissociated cultures and in organotypic hippocampal slices. The indirect neurotoxicity was prevented by (i) doxycycline, an inhibitor of microglia activation; (ii) TRAM-34, a selective KCa3.1 blocker; and (iii) two inhibitors of inducible NO synthase, indicating that KCa3.1 activity and excessive NO release are required for AβO-induced microglial neurotoxicity. Our results suggest that AβO, generally considered a neurotoxin, may more potently cause neuronal damage indirectly by activating microglia in AD.


Figures

FIGURE 1.
FIGURE 1.
Synthetic and human-derived AβO stimulates microglia proliferation at subneurotoxic concentrations. A, microglia were treated with AβO of indicated Aβ concentrations for 48 h. All of the cells in the microglia cultures were stained with Calcein AM. The identity of cells was confirmed by immunostaining with IBA-1, a microglia marker. Cont, control. B, the number of cells in each condition was determined. AβO treatment caused microglia proliferation in a dose-dependent manner, and the effect tapered off at 100 nm. Aβ monomer caused a mild but statistically not significant increase of proliferation. The data presented are the means ± S.E. (n = 3). *, p < 0.05; **, p < 0.001 compared with the 0 nm solvent treatment controls. C, mitogenic assay based on BrdUrd incorporation. AβO treatment caused a dose-dependent incorporation of BrdUrd, following a bell-shaped curve (n = 3). *, p < 0.05; **, p < 0.001 compared with the 0 nm solvent treatment controls. D, microglia were treated for 24 h with 20 nm AβO or mock-treated with solvent, in the presence of A11 (50 nm), or CR (100 nm), and the cell numbers were determined (n = 5). *, p < 0.001; #, p < 0.05. As a control for the specificity of A11, a rabbit polyclonal antiserum specific for Aβ40 (anti-Aβ40) was also tested and showed no difference from the control. E, soluble extracts with a 10–100-kDa molecular mass cut-off were obtained from AD and control hippocampi. Microglia were treated with these extracts diluted into the medium at indicated percentile (v/v), and the numbers of cells were determined after 24 h. Shown are data from using a representative pair of AD (black bars) and control (white bars) extracts. The actual Aβ42 concentrations (Conc., in nm) for the indicated dilutions of the AD extract are indicated on the x axis (n = 3). *, p < 0.05 for control versus AD in each concentration between the pair of extracts; **, p < 0.001 for 10% AD versus 10% AD + A11 and for 10% AD versus 10% AD + CR.
FIGURE 2.
FIGURE 2.
AβO (20 nm) treatment induced an activated phenotype of microglia. A, photomicrographs of microglia treated for 24 h with solvent, 20 nm AβO, 50 nm fAβ, 100 ng/ml LPS, and 100 ng/ml macrophage colony stimulatory factor, respectively. B, time course of p38 MAPK activation. A representative set of data is shown. Microglia were treated for 30 min with AβO, AβO with 20 μm doxycycline (Doxy), AβO with 1 μm TRAM-34, or the compound alone. The activation state of p38 MAPK was evaluated by Western blot using an antibody for its phosphorylated epitope. An antibody for p38 MAPK was used to quantify the total p38 MAPK level. The activation of p38 MAPK is represented by the band intensity of phosph-p38 MAPK (p-p38) normalized to that of total p38 MAPK (t-p38). C, quantification from three independent experiments. #, p < 0.001 compared with the 0-min control; *, p < 0.05; **, p < 0.001 compared with the AβO group in the same time point. There was no significant difference between the 0-min control versus AβO + TRAM-34 at any time point. There was no significant difference between AβO versus AβO + doxycycline after 30 min. D, microglia after the indicated treatment for 2 h were immunostained with an antibody for p65 of NFκB to mark cells with NFκB activation. Numbers of p65-immunoreactive cells/200 DAPI-labeled cells were determined. Treatment with AβO and LPS increased the number of cells with activated NFκB (n = 6). *, p < 0.001 compared with control. The AβO-induced activation was prevented by 20 μm doxycycline and 1 μm TRAM-34. **, p < 0.001 compared with the AβO group. LPS-induced activation was prevented by doxycycline. #, p < 0.001 compared with the LPS group but not significantly by TRAM-34. E, nitric oxide (i.e. nitrite) production by microglia after 24 h of indicated treatment was measured in the conditioned medium and normalized by the amount of total cellular protein in each culture. Treatment with AβO and LPS increased microglia NO production (n = 4). *, p < 0.001 compared with control. The AβO- and LPS-induced increase was prevented by 20 μm doxycycline and 1 μm TRAM-34 (n = 4). **, p < 0.001 compared with the AβO group. Doxycycline or TRAM-34 alone did not affect NO production.
FIGURE 3.
FIGURE 3.
Blockade of AβO-induced microglia activation. Microglia were treated with (black bars) or without (white bars) 20 nm AβO for 24 h in the presence of indicated inhibitors: 100 ng/ml polyinosinic acid, 10 μg/ml anti-SRA antibody E-20 and 2F8, 20 μm doxycycline, or 1 μm TRAM-34 (n = 4). *, p < 0.05; **, p < 0.001 compared with the +AβO control group.
FIGURE 4.
FIGURE 4.
Mouse microglia express the calcium-activated K+ channel KCa3.1. A, scatter plot of TRAM-34-sensitive (KCa3.1) current density and two representative recordings showing the effect of 1 μm TRAM-34. B, the KCa current is insensitive to the KCa2 channel blocker apamin.
FIGURE 5.
FIGURE 5.
AβO caused indirect, microglia-mediated neurotoxicity. Hippocampal neurons, 14 days in vitro, were treated with three kinds of media diluted into the neuronal culture medium at the indicated percentiles for 24 h. They are (i) medium with direct addition of AβO (20 nm) but without conditioned by microglia (+AβO), (ii) medium previously conditioned by unstimulated microglia (+Con-CM), (iii) medium previously conditioned by AβO (20 nm)-stimulated microglia (+AβO-CM), and (iv) medium previously conditioned by LPS (100 ng/ml)-stimulated microglia (+LPS-CM). Neuronal viability was evaluated by the MTT assay (n = 3; except n = 1 for the LPS-CM group). *, p < 0.05; **, p < 0.001; ***, p < 0.0001 compared with the control (no addition) group. #, p < 0.05; ##, p < 0.001 when compared with the +Con-CM values of the same dilution of microglia CM.
FIGURE 6.
FIGURE 6.
AβO caused indirect, microglia-mediated damage to dendrites and synapses. The levels of dendritic and synaptic markers were compared between hippocampal neurons treated with solvent only (mock treatment), 20 nm AβO, Con-CM, AβO-CM (see Fig. 5), or CM from microglia cultures in which AβO-induced activation was inhibited by doxycycline (AβO-CM + doxycycline) or TRAM-34 (AβO-CM + TRAM-34), for 24 h. All of the CM used were diluted at 12.5% into the neuronal culture medium. A, dendrites were demonstrated by immunostaining for Ac-TN (green). B, for better visualization of individual dendrites, dendrites of the sparsely plated neurons were demonstrated by immunostaining for MAP2 (red). The inset contains a magnified image showing the “beaded” appearance of dendrites of AβO-CM-treated neurons. C, PSD95-immunoreactive puncta (green) along representative segments of dendrites. D, The mean counts of PSD95-immunoreactive puncta per unit (100 μm) length. AβO-CM treatment significantly reduced the PSD95 count (n = 3). *, p < 0.001 compared with the Con-CM group. This reduction was prevented by inhibition of microglia activation by 20 μm doxycycline or 1 μm TRAM-34 (n = 3). #, p < 0.001 compared with the AβO-CM group. E, Western blot analysis of lysates from neurons with indicated treatment, analyzed by antibodies to dendritic proteins Ac-TN and MAP2, postsynaptic proteins PSD95 and GRIP1, and presynaptic protein synaptophysin.
FIGURE 7.
FIGURE 7.
AβO activated microglia and caused indirect, microglia-mediated neurotoxicity in hippocampal slices. The treatment consisted of 20 nm AβO for 24 h. A, hippocampal slices were treated as indicated and stained with Hoechst to outline the slices and with anti-CD11b (green) and anti-SRA (red) to evaluate microglia activation. AβO treatment caused increased staining of CD11b and SRA. A magnified image from an outlined SRA-immunoreactive area is shown on the far right to demonstrate the activated morphology of microglia. B, NO production was measured as nitrite level in the conditioned medium as described in Fig. 2E and normalized to the amount of total protein of the slice. Treatment with AβO and LPS increased NO production from hippocampal slices (n = 4). #, p < 0.001 compared with the control group. The AβO-induced increase was prevented by 20 μm doxycycline and 1 μm TRAM-34 (n = 4). *, p < 0.05 compared with the AβO group. Doxycycline or TRAM-34 alone did not affect NO production. C, paired consecutive slices received the same indicated treatment. One slice was then used for PI uptake study for neuronal damage, and the other for CD11b staining for microglia activation. There was low background PI uptake and CD11b staining in the control slices. AβO significantly enhanced PI uptake and CD11b staining, which were ameliorated by doxycycline and TRAM-34. The locations of hippocampal subfields CA1, CA3, and dentate gyrus (DG) are indicated. D, Western blot analysis of lysates from hippocampal slices with indicated treatment, analyzed by antibodies to dendritic proteins Ac-TN and MAP2, postsynaptic proteins PSD95 and GRIP1, and the presynaptic protein synaptophysin.
FIGURE 8.
FIGURE 8.
NO mediates AβO-induced microglial neurotoxicity. A, NO production was quantified as described for Fig. 2E. The AβO-induced increase was prevented by 5 μm 1400W and 100 μm l-NIL (n = 3). *, p < 0.01 compared with the AβO group. B, AβO-induced microglial neurotoxicity was evaluated as described for Fig. 5. Control or AβO-treated microglia cultures were at the same time treated with vehicle, 1400W, or l-NIL for 24 h. Hippocampal neuron cultures were then treated with 25% CM from each microglial culture. Neuronal viability was determined after 24 h. Both 1400W and l-NIL blocked the AβO-induced microglial neurotoxicity (n = 3). *, p < 0.001 compared with the AβO-CM/vehicle group. C, NO released by hippocampal slices was measured as described in Fig. 7B. Both 1400W and l-NIL blocked AβO-induced NO production (n = 3). *, p < 0.001 compared with the AβO group. D, hippocampal slices were treated with the indicated conditions, and the PI uptake assay was performed as described for Fig. 7C. The same slices were then immunostained with NeuN that marked neuronal nuclei (NeuN, green; PI uptake, red). A magnified image from an outlined area in the CA1 region of the AβO-treated hippocampal slice is shown on the right upper panel to demonstrate the substantial colocalization of NeuN immunoreactivity and PI fluorescence. Both 1400W and l-NIL blocked AβO-induced neuronal damage as indicated by significantly reduced PI uptake.

Similar articles

Cited by

References

    1. Cameron B., Landreth G. E. (2010) Neurobiol. Dis. 37, 503–509 - PMC - PubMed
    1. Terry R. D., Masliah E., Salmon D. P., Butters N., DeTeresa R., Hill R., Hansen L. A., Katzman R. (1991) Ann. Neurol. 30, 572–580 - PubMed
    1. Hardy J., Selkoe D. J. (2002) Science 297, 353–356 - PubMed
    1. Edison P., Archer H. A., Gerhard A., Hinz R., Pavese N., Turkheimer F. E., Hammers A., Tai Y. F., Fox N., Kennedy A., Rossor M., Brooks D. J. (2008) Neurobiol. Dis. 32, 412–419 - PubMed
    1. Okello A., Edison P., Archer H. A., Turkheimer F. E., Kennedy J., Bullock R., Walker Z., Kennedy A., Fox N., Rossor M., Brooks D. J. (2009) Neurology 72, 56–62 - PMC - PubMed

Publication types

Substances

LinkOut - more resources