New blue pigment produced by Pantoea agglomerans and its production characteristics at various temperatures
- PMID: 20971865
- PMCID: PMC3019727
- DOI: 10.1128/AEM.00264-10
New blue pigment produced by Pantoea agglomerans and its production characteristics at various temperatures
Abstract
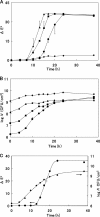
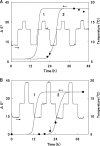
A bacterium capable of producing a deep blue pigment was isolated from the environment and identified as Pantoea agglomerans. The pigment production characteristics of the bacterium under various conditions were studied. The optimal agar plate ingredients for pigment production by the bacterium were first studied: the optimal ingredients were 5 g/liter glucose, 10 g/liter tryptic soy broth, and 40 g/liter glycerol at pH 6.4. Bacterial cells grew on the agar plate during the incubation, while the pigment spread into the agar plate, meaning that it is water soluble. Pigment production was affected by the initial cell density. Namely, at higher initial cell densities ranging from 10(6.3) to 10(8.2) CFU/cm(2) on the agar plate, faster pigment production was observed, but no blue pigment was produced at a very high initial density of 10(9.1) CFU/cm(2). Thus, the cell population of 10(8.2) CFU/cm(2) was used for subsequent study. Although the bacterium was capable of growing at temperatures above and below 10°C, it could produce the pigment only at temperatures of ≥10°C. Moreover, the pigment production was faster at higher temperatures in the range of 10 to 20°C. Pigment production at various temperature patterns was well described by a new logistic model. These results suggested that the bacterium could be used in the development of a microbial temperature indicator for the low-temperature-storage management of foods and clinical materials. To our knowledge, there is no other P. agglomerans strain capable of producing a blue pigment and the pigment is a new one of microbial origin.
Figures


References
-
- Barrow, G. I., and R. K. A. Feltham (ed.). 1993. Cowan and Steel's manual for the identification of medical bacteria, 3rd ed. Cambridge University Press, Cambridge, United Kingdom.
-
- Ellouze, M., M. Pichaud, C. Bonaiti, L. Coroller, O. Couvert, D. Thualt, and R. Vaillant. 2008. Modelling pH evolution and lactic acid production in the growth medium of a lactic acid bacterium: application to set a biological TTI. Int. J. Food Microbiol. 128:101-108. - PubMed
-
- Fu, B., P. S. Taukis, and T. P. Labuza. 1991. Predictive microbiology for monitoring spoilage of dairy products with time-temperature integrators. J. Food Sci. 56:1209-1215.
-
- Fujikawa, H., A. Kai, and S. Morozumi. 2004. A new logistic model for Escherichia coli at constant and dynamic temperatures. Food Microbiol. 21:501-509.
Publication types
MeSH terms
Substances
LinkOut - more resources
Full Text Sources
Other Literature Sources
Molecular Biology Databases

