

Growth and virulence properties of biofilm-forming Salmonella enterica serovar typhimurium under different acidic conditions
- PMID: 20971873
- PMCID: PMC3008236
- DOI: 10.1128/AEM.01508-10
Growth and virulence properties of biofilm-forming Salmonella enterica serovar typhimurium under different acidic conditions
Abstract
This study was designed to characterize the viability and potential virulence of bofilm-forming Salmonella enterica serovar Typhimurium under different pH levels, ranging from 5 to 7. The plate count method and real-time reverse transcription-PCR (RT-PCR) were used to evaluate the survival of S. Typhimurium grown in Trypticase soy broth (TSB) adjusted to pH 5, 6, and 7 (TSB-5, TSB-6, and TSB-7, respectively) at 37°C for 10 days. In TSB-5 and TSB-6, the numbers of viable cells estimated by using the real-time RT-PCR were greater than the culturable counts enumerated by the plate count method. Reflectance micro-Fourier transform infrared (micro-FTIR) spectroscopy was used to evaluate the biochemical changes in biofilm cells. Considerable changes in chemical components were observed in the biofilm cells grown in TSB-5 and TSB-6 when compared to the cells grown in TSB-7. The enterotoxin production and invasive ability of planktonic and biofilm S. Typhimurium cells were inferred by the relative levels of expression of stn and invA. The levels of expression of stn and invA were significantly increased in biofilm S. Typhimurium cells grown in TSB-5 (1.9-fold and 3.2-fold) and TSB-6 (2.1-fold and 22.3-fold) after 10 days of incubation. These results suggest that the biofilm-forming S. Typhimurium under different pH levels might change the virulence production and stress response mechanisms.
Figures


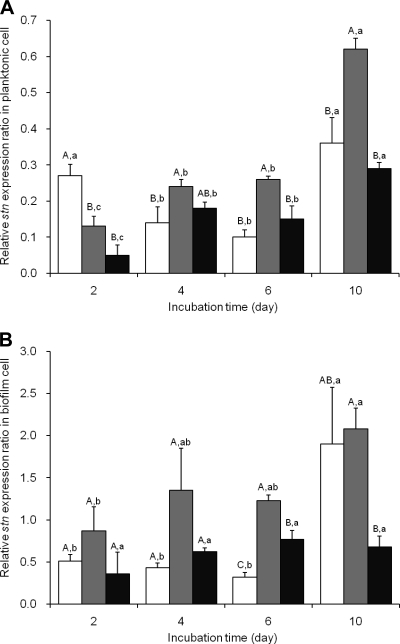
 ), and pH 7.0 (TSB-7; ▪) during 10 days of incubation at 37°C. Mean values with different letters within the same incubation time (A and B) and the same pH value (a to c) are significantly different at P < 0.05.
 ), and pH 7.0 (TSB-7; ▪) during 10 days of incubation at 37°C. Mean values with different letters within the same incubation time (A to C) and the same pH value (a to c) are significantly different at P < 0.05.
Similar articles
-
Acid environments affect biofilm formation and gene expression in isolates of Salmonella enterica Typhimurium DT104.Int J Food Microbiol. 2015 Aug 3;206:7-16. doi: 10.1016/j.ijfoodmicro.2015.03.030. Epub 2015 Apr 3. Int J Food Microbiol. 2015. PMID: 25912312
-
gcpA (stm1987) is critical for cellulose production and biofilm formation on polystyrene surface by Salmonella enterica serovar Weltevreden in both high and low nutrient medium.Microb Pathog. 2011 Feb;50(2):114-22. doi: 10.1016/j.micpath.2010.12.002. Epub 2010 Dec 10. Microb Pathog. 2011. PMID: 21147214
-
The combined effect of stressful factors (temperature and pH) on the expression of biofilm, stress, and virulence genes in Salmonella enterica ser. Enteritidis and Typhimurium.Arch Microbiol. 2021 Sep;203(7):4475-4484. doi: 10.1007/s00203-021-02435-y. Epub 2021 Jun 17. Arch Microbiol. 2021. PMID: 34137898
-
Adaptive acid tolerance response in Salmonella enterica serovar Typhimurium and Salmonella enterica serovar Typhi.J Basic Microbiol. 2004;44(2):137-46. doi: 10.1002/jobm.200310333. J Basic Microbiol. 2004. PMID: 15069673
-
Regulation of biofilm formation in Salmonella enterica serovar Typhimurium.Future Microbiol. 2014;9(11):1261-82. doi: 10.2217/fmb.14.88. Future Microbiol. 2014. PMID: 25437188 Review.
Cited by
-
Novel In Vivo Assessment of Antimicrobial Efficacy of Ciprofloxacin Loaded Mesoporous Silica Nanoparticles against Salmonella typhimurium Infection.Pharmaceuticals (Basel). 2022 Mar 15;15(3):357. doi: 10.3390/ph15030357. Pharmaceuticals (Basel). 2022. PMID: 35337154 Free PMC article.
-
Changing Patterns of Salmonella enterica Serovar Rissen From Humans, Food Animals, and Animal-Derived Foods in China, 1995-2019.Front Microbiol. 2021 Jul 29;12:702909. doi: 10.3389/fmicb.2021.702909. eCollection 2021. Front Microbiol. 2021. PMID: 34394048 Free PMC article.
-
Rapid detection of Salmonella enterica in raw milk samples using Stn gene-based biosensor.3 Biotech. 2019 Nov;9(11):425. doi: 10.1007/s13205-019-1957-4. Epub 2019 Oct 28. 3 Biotech. 2019. PMID: 31696030 Free PMC article.
-
Internalization of Salmonella in Leafy Greens and Impact on Acid Tolerance.Appl Environ Microbiol. 2022 Mar 22;88(6):e0224921. doi: 10.1128/aem.02249-21. Epub 2022 Feb 2. Appl Environ Microbiol. 2022. PMID: 35108086 Free PMC article.
-
Criteria for selection of surrogates used to study the fate and control of pathogens in the environment.Appl Environ Microbiol. 2012 Mar;78(6):1969-77. doi: 10.1128/AEM.06582-11. Epub 2012 Jan 13. Appl Environ Microbiol. 2012. PMID: 22247166 Free PMC article.
References
-
- Abdelwaheb, C., and L. Ahmed. 2009. Acid pre-adaptation enhances virulence of Salmonella enterica serovar Typhimurium dam mutant. Pathol. Biol. 57:358-362. - PubMed
-
- Adams, M. R., and M. O. Moss. 2000. Food microbiology. Royal Society of Chemistry, Cambridge, United Kingdom.
-
- Audia, J. P., C. C. Webb, and J. W. Foster. 2001. Breaking through the acid barrier: an orchestrated response to proton stress by enteric bacteria. Int. J. Med. Microbiol. 291:97-196. - PubMed
-
- Blaser, M. J., and L. S. Newman. 1982. A review of human salmonellosis. I. Infective dose. Rev. Infect. Dis. 4:1096-1106. - PubMed
-
- Brown, J. L., T. Ross, T. A. McMeekin, and P. D. Nichols. 1997. Acid habituation of Escherichia coli and the potential role of cyclopropane fatty acids in low pH tolerance. Int. J. Food Microbiol. 37:163-173. - PubMed
Publication types
MeSH terms
Substances
LinkOut - more resources
Full Text Sources
