. 2011 Jan;193(1):52-62.
doi: 10.1128/JB.01656-09. Epub 2010 Oct 22.

Glucose-dependent activation of Bacillus anthracis toxin gene expression and virulence requires the carbon catabolite protein CcpA

Affiliations

Glucose-dependent activation of Bacillus anthracis toxin gene expression and virulence requires the carbon catabolite protein CcpA

Christina Chiang et al. J Bacteriol. 2011 Jan.

Abstract

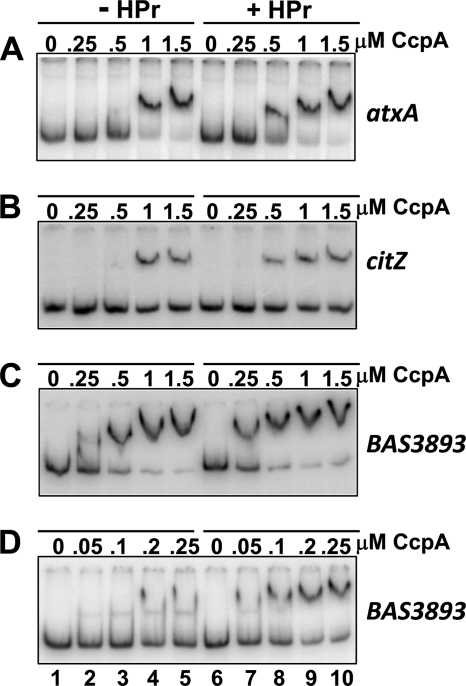
Sensing environmental conditions is an essential aspect of bacterial physiology and virulence. In Bacillus anthracis, the causative agent of anthrax, transcription of the two major virulence factors, toxin and capsule, is triggered by bicarbonate, a major compound in the mammalian body. Here it is shown that glucose is an additional signaling molecule recognized by B. anthracis for toxin synthesis. The presence of glucose increased the expression of the protective antigen toxin component-encoding gene (pagA) by stimulating induction of transcription of the AtxA virulence transcription factor. Induction of atxA transcription by glucose required the carbon catabolite protein CcpA via an indirect mechanism. CcpA did not bind specifically to any region of the extended atxA promoter. The virulence of a B. anthracis strain from which the ccpA gene was deleted was significantly attenuated in a mouse model of infection. The data demonstrated that glucose is an important host environment-derived signaling molecule and that CcpA is a molecular link between environmental sensing and B. anthracis pathogenesis.


Figures

FIG. 1.
FIG. 1.
Schematic representation of the region in plasmid pXO1 containing the atxA gene. The arrows indicate the positions of the open reading frames, and the lines delineate the extent of the fragments cloned in the indicated plasmids. The plasmid carrying the lacZ fusion constructs was generated in vector pTCV-lac (54), while the plasmid carrying the atxA coding sequence under the control of the spac promoter is a derivative of pTCV-spac (see Materials and Methods). The extent of the fragment used as nonspecific (NS) DNA in competition EMSA is also shown.
FIG. 2.
FIG. 2.
Glucose induces expression of the pagA gene. Time courses of β-galactosidase activity were taken for strains 34F2, 34F2ΔccpA, and 34F2ΔccpB carrying a pagA-lacZ fusion construct on the replicative plasmid pTCV-lac (54). Cells were grown in R medium with 0.8% sodium bicarbonate and 0.25% glycerol in a 5% CO2 atmosphere. Glucose or glycerol (without glucose) (0.25%) was added at T2. (A) β-Galactosidase activity expressed in Miller units (45); (B) growth curves. Symbols: open symbols, cultures grown in the presence of glucose; closed symbols: cultures grown in the absence of glucose; circles, parental strain; squares, ΔccpA; triangles, ΔccpB; open inverted triangles, level of β-galactosidase activity obtained with strain 34F2 carrying the pagA-lacZ fusion construct when it was grown in R medium with glucose in air without CO2-bicarbonate.
FIG. 3.
FIG. 3.
Induction of pagA expression by glucose is abolished by the deletion of atxA or by expressing AtxA from the spac promoter. (A) Time courses of β-galactosidase activity in strain 34F2ΔatxA carrying the pagA-lacZ fusion construct in vector pTCV-lac; (B) time courses of β-galactosidase activity in strain 34F2ΔatxA harboring the pagA-lacZ fusion construct in plasmid pORI-lacZ integrated at the pagA locus and the replicative plasmid pAtxA28 expressing the AtxA protein from the constitutive spac promoter. Symbols: ▪, cells grown with glucose; •, cells grown without glucose.
FIG. 4.
FIG. 4.
Glucose-dependent induction of atxA transcription from the P1 promoter requires CcpA. Time courses of β-galactosidase activity were carried out on B. anthracis cultures grown in the presence (open symbols) or absence (closed symbols) of glucose. Glucose or glycerol (0.25%) was added to the R medium at T2 as described in Materials and Methods. Strain 34F2 harbored plasmid pAtxA10 (A), plasmid pAtxA12 (B), or plasmid pAtxA26 (C). (D) Growth curves of the strains whose β-galactosidase activities are shown in panel A as representative growth curves for each set of experiments. Symbols: circles, parental strain 34F2; squares, 34F2ΔccpA mutant strain.
FIG. 5.
FIG. 5.
Western blot analysis of AtxA induction by glucose. (A) Coomassie-stained 12% SDS-polyacrylamide gel. Strain 34F2 was grown in R medium with CO2-bicarbonate in the absence (lane 1) or presence (lane 2) of 0.25% glucose starting at T2. Strain 34F2ΔatxA (lane 3) was grown under the same conditions in the presence of glucose. Samples were taken at T7. Lanes 1, 2, and 3 contained 10 μl of cell lysate normalized to a cell OD600 equivalent to 0.05. (B) Western blotting carried out with polyclonal antibodies raised against AtxA (70). Lanes 1, 2, and 4 correspond to lanes 1, 2, and 3 of panel A, respectively. Lane 3 contained 0.006 μg of purified AtxA protein modified to carry a 6× His tag at the N-terminal end, which accounts for the slightly higher molecular weight. The band corresponding to AtxA is indicated by the arrow. The molecular weight standards (lanes MW) are Page Ruler (Fermentas) in panel A and the Magic Mark XP Western standard (Invitrogen) in panel B.
FIG. 6.
FIG. 6.
Electrophoretic mobility shift assay to determine conditions of CcpA binding to atxA, citZ, and BAS3893 promoter regions. Fragments were generated by PCR amplification and end labeled with [γ-32P]ATP via previous phosphorylation with PNK of one oligonucleotide primer per each set of amplification reactions. A constant amount of probes (1 ng) was incubated at room temperature with the indicated concentrations of CcpA (without HPr [−HPr]) or with CcpA and HPr at a 10 μM final concentration (+HPr). Samples were run on 5% polyacrylamide gels.
FIG. 7.
FIG. 7.
CcpA does not bind specifically to the atxA promoter. Competition EMSAs were carried out on the atxA, citZ, and BAS3893 promoter fragments (1 ng) in the presence of CcpA at the indicated concentrations and HPr at 10 μM. Specific DNA (+ S-DNA) or nonspecific DNA (+ NS-DNA) was added to 300-fold excess. The specific DNAs were the atxA (A), citZ (B), or BAS3893 (C) unlabeled fragments, while the nonspecific DNA in all three panels was the atxA fragment in the coding region generated with oligonucleotide primer set AtxAseq1-AtxAH199A.
FIG. 8.
FIG. 8.
Effect of a ccpA mutation on the expression of citZ and BAS3893. Time courses of β-galactosidase activity were carried out with B. anthracis strains harboring the pTCV-citZ (A) or the pTCV-BAS3893 (B) promoter-lacZ fusion constructs. Strains 34F2 (•) and 34F2ΔccpA (▪) were grown in R medium with 0.25% glucose and CO2-bicarbonate.
FIG. 9.
FIG. 9.
DNase I footprinting analysis of CcpA binding to the atxA (A and B) and BAS3893 (C and D) promoters. Fragments labeled with γ-32P at the 5′ end (coding strand) (A and C) or at the 3′ end (noncoding strand) (B and D) were incubated with CcpA at the following concentrations: 0 μM (lanes 1 and 2), 0.4 μM (lane 3), 1 μM (lane 4), or 2 μM (lane 5). Protected regions in panels C and D are identified by thick lines. Hypersensitive sites are indicated by arrows. The known −10 and −35 promoter regions of atxA are labeled (13). (E) Nucleotide sequence of the BAS3893 promoter region identified by the thin line to the right of panel C. The regions protected in the 5′-labeled fragment are identified by lines above the sequence, while the region protected in the 3′-labeled fragment are shown by the line below the sequence. The region in gray highlights the cre site proposed by van der Voort et al. (72). The cre consensus sequences for B. cereus (38) and B. subtilus (22) are also shown.
FIG. 10.
FIG. 10.
Inactivation of CcpA significantly decreased B. anthracis virulence. Groups of five A/J mice were inoculated subcutaneously with ≈1 × 10⁶ spores of strain 34F2 (•) or 34F2ΔccpA (▪). Percent survival was graphed with Kaplan-Meier survival analysis, and the P value by the log-rank test was 0.0116 (GraphPad Prism, version 5, software).

Similar articles

Cited by

References

    1. Abranches, J., M. M. Nascimento, L. Zeng, C. M. Browngardt, Z. T. Wen, M. F. Rivera, and R. A. Burne. 2008. CcpA regulates central metabolism and virulence gene expression in Streptococcus mutans. J. Bacteriol. 190:2340-2349. - PMC - PubMed
    1. Almengor, A. C., T. L. Kinkel, S. J. Day, and K. S. McIver. 2007. The catabolite control protein CcpA binds to Pmga and influences expression of the virulence regulator Mga in the group A streptococcus. J. Bacteriol. 189:8405-8416. - PMC - PubMed
    1. Arantes, O., and D. Lereclus. 1991. Construction of cloning vectors for Bacillus thuringiensis. Gene 108:115-119. - PubMed
    1. Barabote, R. D., and M. H. Saier, Jr. 2005. Comparative genomic analyses of the bacterial phosphotransferase system. Microbiol. Mol. Biol. Rev. 69:608-634. - PMC - PubMed
    1. Bartkus, J. M., and S. H. Leppla. 1989. Transcriptional regulation of the protective antigen gene of Bacillus anthracis. Infect. Immun. 57:2295-2300. - PMC - PubMed

Publication types

MeSH terms

LinkOut - more resources