

Effects of deficiency and overdose of group 2 sigma factors in triple inactivation strains of Synechocystis sp. strain PCC 6803
- PMID: 20971916
- PMCID: PMC3019964
- DOI: 10.1128/JB.01045-10
Effects of deficiency and overdose of group 2 sigma factors in triple inactivation strains of Synechocystis sp. strain PCC 6803
Abstract
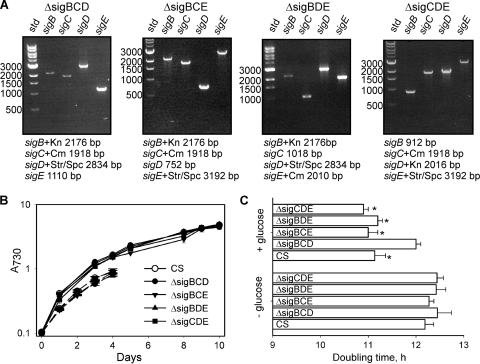
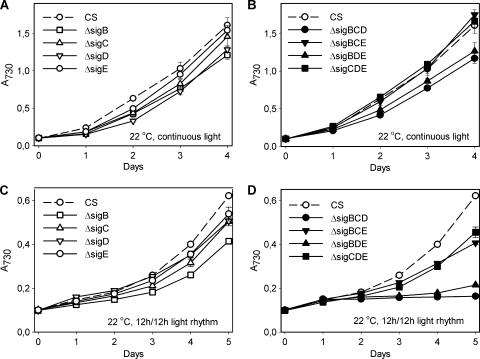
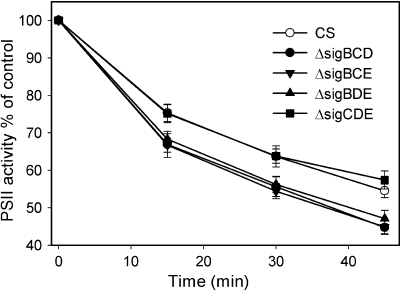
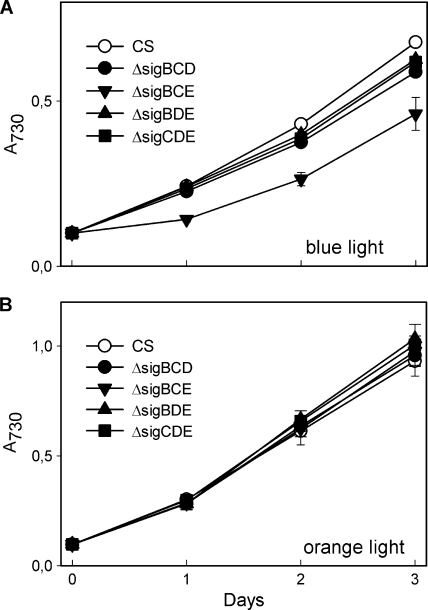
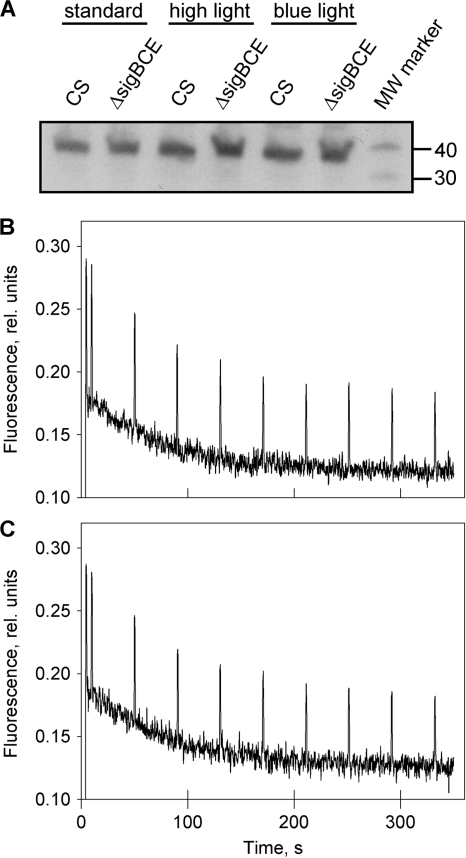
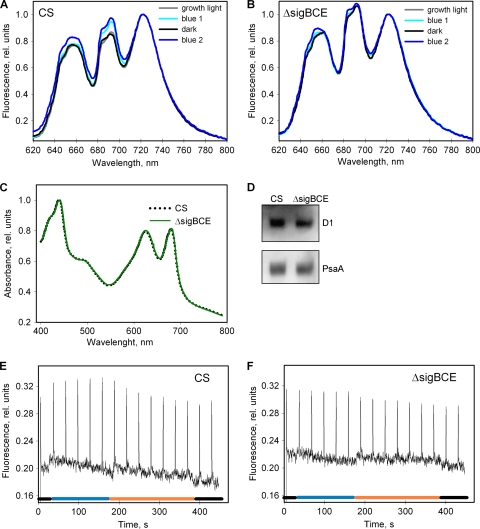
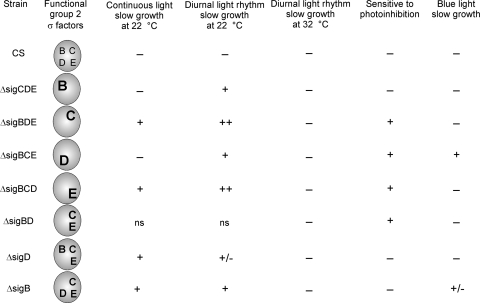
Acclimation of cyanobacteria to environmental changes includes major changes in the gene expression patterns partly orchestrated by the replacement of a particular σ subunit with another in the RNA polymerase holoenzyme. The cyanobacterium Synechocystis sp. strain PCC 6803 encodes nine σ factors, all belonging to the σ(70) family. Cyanobacteria typically encode many group 2 σ factors that closely resemble the principal σ factor. We inactivated three out of the four group 2 σ factors of Synechocystis simultaneously in all possible combinations and found that all triple inactivation strains grow well under standard conditions. Unlike the other strains, the ΔsigBCD strain, which contains SigE as the only functional group 2 σ factor, did not grow faster under mixotrophic than under autotrophic conditions. The SigB and SigD factors were important in low-temperature acclimation, especially under diurnal light rhythm. The ΔsigBCD, ΔsigBCE, and ΔsigBDE strains were sensitive to high-light-induced photoinhibition, indicating a central role of the SigB factor in high-light tolerance. Furthermore, the ΔsigBCE strain (SigD is the only functional group 2 σ factor) appeared to be locked in the high-fluorescence state (state 1) and grew slowly in blue but not in orange or white light. Our results suggest that features of the triple inactivation strains can be categorized as (i) direct consequences of the inactivation of a particular σ factor(s) and (ii) effects resulting from the higher probability that the remaining group 2 σ factors associate with the RNA polymerase core.
Figures
Similar articles
-
Impact of different group 2 sigma factors on light use efficiency and high salt stress in the cyanobacterium Synechocystis sp. PCC 6803.PLoS One. 2013 Apr 26;8(4):e63020. doi: 10.1371/journal.pone.0063020. Print 2013. PLoS One. 2013. PMID: 23638176 Free PMC article.
-
Roles of Group 2 Sigma Factors in Acclimation of the Cyanobacterium Synechocystis sp. PCC 6803 to Nitrogen Deficiency.Plant Cell Physiol. 2016 Jun;57(6):1309-18. doi: 10.1093/pcp/pcw079. Epub 2016 Apr 19. Plant Cell Physiol. 2016. PMID: 27095737
-
Group 2 sigma factor mutant ΔsigCDE of the cyanobacterium Synechocystis sp. PCC 6803 reveals functionality of both carotenoids and flavodiiron proteins in photoprotection of photosystem II.Plant Cell Physiol. 2013 Nov;54(11):1780-90. doi: 10.1093/pcp/pct123. Epub 2013 Sep 4. Plant Cell Physiol. 2013. PMID: 24009334
-
Simultaneous inactivation of sigma factors B and D interferes with light acclimation of the cyanobacterium Synechocystis sp. strain PCC 6803.J Bacteriol. 2009 Jun;191(12):3992-4001. doi: 10.1128/JB.00132-09. Epub 2009 Apr 10. J Bacteriol. 2009. PMID: 19363110 Free PMC article.
-
Acclimation to high-light conditions in cyanobacteria: from gene expression to physiological responses.J Plant Res. 2012 Jan;125(1):11-39. doi: 10.1007/s10265-011-0454-6. Epub 2011 Oct 18. J Plant Res. 2012. PMID: 22006212 Review.
Cited by
-
Modification of photosynthetic electron transport and amino acid levels by overexpression of a circadian-related histidine kinase hik8 in Synechocystis sp. PCC 6803.Front Microbiol. 2015 Oct 20;6:1150. doi: 10.3389/fmicb.2015.01150. eCollection 2015. Front Microbiol. 2015. PMID: 26539179 Free PMC article.
-
The ω subunit of RNA polymerase is essential for thermal acclimation of the cyanobacterium Synechocystis sp. PCC 6803.PLoS One. 2014 Nov 11;9(11):e112599. doi: 10.1371/journal.pone.0112599. eCollection 2014. PLoS One. 2014. PMID: 25386944 Free PMC article.
-
Impact of different group 2 sigma factors on light use efficiency and high salt stress in the cyanobacterium Synechocystis sp. PCC 6803.PLoS One. 2013 Apr 26;8(4):e63020. doi: 10.1371/journal.pone.0063020. Print 2013. PLoS One. 2013. PMID: 23638176 Free PMC article.
-
Acclimation to High CO2 Requires the ω Subunit of the RNA Polymerase in Synechocystis.Plant Physiol. 2017 May;174(1):172-184. doi: 10.1104/pp.16.01953. Epub 2017 Mar 28. Plant Physiol. 2017. PMID: 28351910 Free PMC article.
-
Roles of Close Homologues SigB and SigD in Heat and High Light Acclimation of the Cyanobacterium Synechocystis sp. PCC 6803.Life (Basel). 2022 Jan 21;12(2):162. doi: 10.3390/life12020162. Life (Basel). 2022. PMID: 35207450 Free PMC article.
References
-
- El Bissati, K., E. Delphin, N. Murata, A. Etienne, and D. Kirilovsky. 2000. Photosystem II fluorescence quenching in the cyanobacterium Synechocystis PCC 6803: involvement of two different mechanisms. Biochim. Biophys. Acta 1457:229-242. - PubMed
-
- Foster, J. S., A. K. Singh, L. J. Rothschild, and L. A. Sherman. 2007. Growth-phase dependent differential gene expression in Synechocystis sp. strain PCC 6803 and regulation by a group 2 sigma factor. Arch. Microbiol. 187:265-279. - PubMed
-
- Gunnelius, L., I. Tuominen, S. Rantamäki, M. Pollari, V. Ruotsalainen, E. Tyystjärvi, and T. Tyystjärvi. 2010. SigC sigma factor is involved in acclimation to low inorganic carbon at high temperature in Synechocystis sp. PCC 6803. Microbiology 156:220-229. - PubMed
Publication types
MeSH terms
Substances
LinkOut - more resources
Full Text Sources
