. 2011 Jan 20;117(3):1005-13.
doi: 10.1182/blood-2010-07-297713. Epub 2010 Oct 22.

The kinetics of αIIbβ3 activation determines the size and stability of thrombi in mice: implications for antiplatelet therapy

Affiliations

The kinetics of αIIbβ3 activation determines the size and stability of thrombi in mice: implications for antiplatelet therapy

Moritz Stolla et al. Blood. .

Abstract

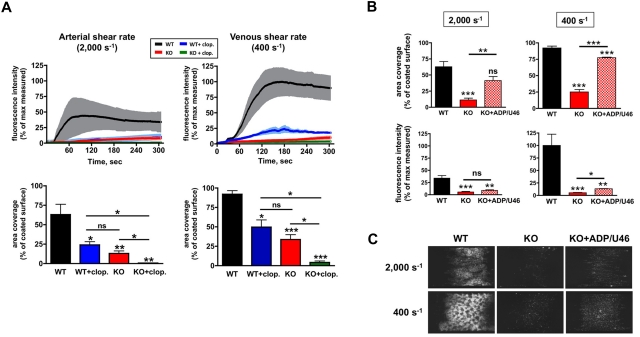
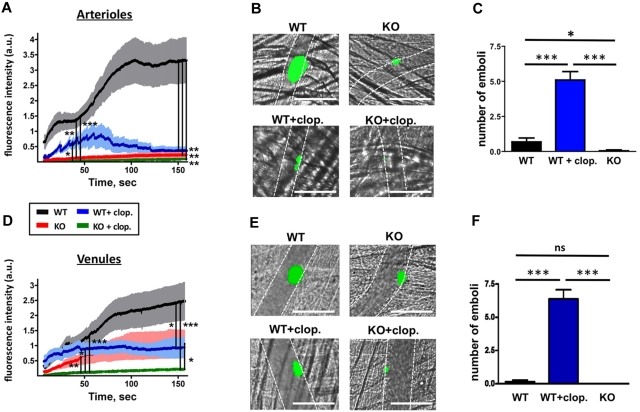
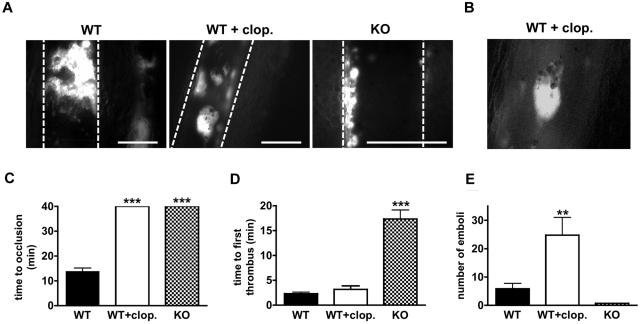
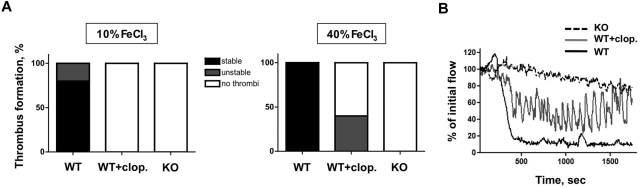
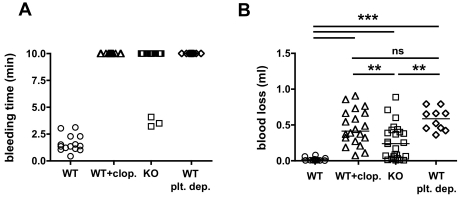
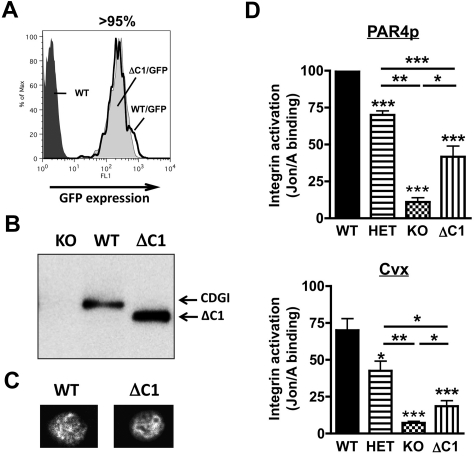
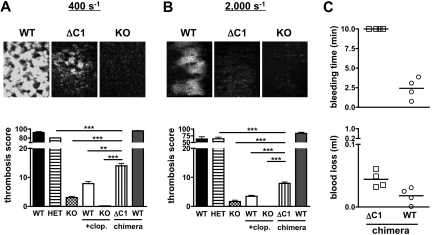
Two major pathways contribute to Ras-proximate-1-mediated integrin activation in stimulated platelets. Calcium and diacyglycerol-regulated guanine nucleotide exchange factor I (CalDAG-GEFI, RasGRP2) mediates the rapid but reversible activation of integrin αIIbβ3, while the adenosine diphosphate receptor P2Y12, the target for antiplatelet drugs like clopidogrel, facilitates delayed but sustained integrin activation. To establish CalDAG-GEFI as a target for antiplatelet therapy, we compared how each pathway contributes to thrombosis and hemostasis in mice. Ex vivo, thrombus formation at arterial or venous shear rates was markedly reduced in CalDAG-GEFI(-/-) blood, even in the presence of exogenous adenosine diphosphate and thromboxane A(2). In vivo, thrombosis was virtually abolished in arterioles and arteries of CalDAG-GEFI(-/-) mice, while small, hemostatically active thrombi formed in venules. Specific deletion of the C1-like domain of CalDAG-GEFI in circulating platelets also led to protection from thrombus formation at arterial flow conditions, while it only marginally increased blood loss in mice. In comparison, thrombi in the micro- and macrovasculature of clopidogrel-treated wild-type mice grew rapidly and frequently embolized but were hemostatically inactive. Together, these data suggest that inhibition of the catalytic or the C1 regulatory domain in CalDAG-GEFI will provide strong protection from athero-thrombotic complications while maintaining a better safety profile than P2Y12 inhibitors like clopidogrel.


Figures

Figure 1
Figure 1
Platelet adhesion to fibrillar collagen under physiological flow conditions. (A) Whole blood from WT (WT, black lines and bars), CalDAG-GEFI−/− (knockout [KO], red), clopidogrel-treated WT (WT + clop., blue), or clopidogrel-treated KO (KO + clop., green) mice was perfused over collagen at arterial (2000 s−1, left) or venous (400 s−1, right) shear conditions. Platelets in whole blood were labeled with Alexa488-labeled antibodies to GPIX before perfusion. The top graphs represent time traces of the mean fluorescence intensity ± SEM expressed as a percentage of the maximal fluorescence observed (WT blood, 400 s−1). The bar graphs show the area coverage by fluorescent platelets after 5 minutes of blood perfusion, expressed as percentage of the collagen-coated area. Data are shown as mean ± SEM (n = 4-6, 3 independent experiments). *P < .05, **P < .01, ***P < .001. See supplemental Videos 1 to 4 for a better visualization of the differences in thrombus growth and stability observed in the respective study groups. (B-C) Effect of exogenous ADP and TxA2 (U46619) on the adhesion of CalDAG-GEFI−/− platelets. WT and CalDAG-GEFI−/− (KO) whole blood was perfused over collagen at 400 s−1 or 2000 s−1 in the presence (KO + ADP/U46) or absence (KO) of exogenous ADP (25μM) and U46619 (5μM). (B) Bar graphs for area coverage (top) and fluorescence intensity (bottom) measured after 5 minutes of perfusion with the following blood samples: WT (black bar), KO (red bar), and KO reconstituted with 25μM ADP and 5μM U46619 (KO + ADP/U46, red checkered bar). Data are shown as mean ± SEM (n = 5, 3 independent experiments). *P < .05; **P < .01; ***P < .001. (C) Representative images. Images were obtained after 5 minutes of perfusion on a Nikon Eclipse Ti-U inverted microscope (equipped with a Retiga EXL monochrome camera [QImaging] and Nikon NIS Elements software [NIS-Elements Advanced Research]).
Figure 2
Figure 2
Laser-induced thrombosis in the cremaster muscle microcirculation. Mice were injected with Alexa488-labeled Fab fragments of MWReg30. (A,D) Changes in fluorescence intensity over time measured after laser injury in cremaster muscle arterioles (A) or venules (D) of the following mouse groups: WT (black line), CalDAG-GEFI−/− (KO, red), WT/clopidogrel (WT + clop., blue), CalDAG-GEFI−/− / clopidogrel (KO + clop., green). Results represent the mean fluorescence intensity ± SEM measured in 3 independent experiments (n = 9-27 vessels for each group). Only significant differences (*P < .05; **P < .01; ***P < .001) are shown. (B,E) Representative images taken at t = 150” after laser injury in arterioles (B) and venules (E). See supplemental Videos 5-8 for a better visualization of the differences in thrombus growth and stability observed in the respective study groups. Images were obtained on a Olympus BX61WI microscope (Olympus) with a ×40/0.8 numeric aperture water-immersion objective lens, using Slidebook software (Intelligent-Imaging-Systems). Dotted lines mark the vessel wall. White bar = 100 μm. (C,F) Number of emboli with a diameter of more than 10 μm forming after laser injury in arterioles (C) or venules (F) of WT, WT/clopidogrel, and CalDAG-GEFI−/− mice. n = 7-9. Mean venule diameter: WT: 63.4 ± 8.5 μm; WT + clopidogrel: 69.1 ± 8.8 μm; CalDAG-GEFI−/−: 55.9 ± 6.1 μm; CalDAG-GEFI−/− + clopidogrel: 60.2 ± 4.2 μm; P = nonsignificant (NS) for all comparisons. Mean arteriole diameter: WT: 37.3 ± 3.0 μm; WT + clopidogrel: 33.7 ± 1.7 μm; CalDAG-GEFI−/−: 38.1 ± 2.5 μm; CalDAG-GEFI−/− + clopidogrel: 37.1 ± 1.9 μm; P = NS for all comparisons.
Figure 3
Figure 3
FeCl3-induced thrombosis in the mesentery. (A) Images of mesenteric venules taken 13 minutes after FeCl3 injury. Platelets were labeled by infusion of fluorophore-labeled antibodies to platelet receptor GPIX. White bar = 100 μm. Dotted lines mark the vessel wall. Representative of 5 independent experiments. (B) Embolizing thrombi in clopidogrel-treated WT animals stained positive for JON/A-PE, a probe that selectively detects the activated form of αIIbβ3 integrin. Representative of 3 experiments. (C) Mean occlusion time in FeCl3-injured venules of mice of WT (solid black bar), WT/clopidogrel (WT + clop., solid white), and CalDAG-GEFI−/− (KO, checkered) mice (n = 7-9). Note that none of the WT/clopidogrel or CalDAG-GEFI−/− mice occluded within the 40 minutes observation period. (D) Average time required to form a first thrombus of more than 20 μm in diameter. (E) Number of emboli with a diameter of more than 20 μm forming 8-13 minutes after FeCl3 injury. Mean venule diameter: WT: 254.9 ± 19.5 μm; WT + clopidogrel: 305 ± 28.7 μm; CalDAG-GEFI−/−: 239 ± 13.7 μm; P = NS for all comparisons. All images were obtained on a Nikon Eclipse Ti-U inverted microscope (Nikon) equipped with a Retiga EXL monochrome camera (QImaging) and the Nikon NIS Elements software (NIS-Elements Advanced Research).
Figure 4
Figure 4
FeCl3-induced thrombosis in the carotid artery. (A) Percentage of mice showing stable, unstable, or no thrombi in response to exposure of the carotid artery to 10% FeCl3 for 4 minutes (left) or 40% FeCl3 for 2.5 minutes (right). n = 5 for all of the indicated study groups. (B) Flow traces recorded after exposure of the carotid artery of a WT (WT, black line), WT + clopidogrel (WT + clop., gray line), or CalDAG-GEFl−/− mouse (KO, dotted black line) to 40% FeCl3 for 2.5 minutes. Note the repeated changes in blood flow in the clopidogrel-treated WT mouse, indicative of the generation of near-occlusive thrombi followed by embolization.
Figure 5
Figure 5
CalDAG-GEFI–deficient mice show a similar bleeding time but a reduced amount of blood loss compared with clopidogrel-treated WT mice. (A) Tail-bleeding time in WT (circle, n = 14), clopidogrel-treated WT (WT + clop., triangle, n = 20), CalDAG-GEFI−/− (KO, square, n = 25), and platelet-depleted mice (WT plt. dep., diamond, n = 10). Three independent experiments. (B) Blood volume lost from the severed tails. Each dot represents the bleeding time or blood loss volume determined in individual mice.
Figure 6
Figure 6
Reduced integrin activation in platelets expressing CalDAG-GEFIΔC1. (A) Representative flow cytometric analysis of the GFP expression in platelets from chimeric mice expressing intact CalDAG-GEFI (WT/GFP, solid black line) or CalDAG-GEFIΔC1 (ΔC1/GFP, light gray shaded area) in comparison to WT control platelets (dark gray shaded area). (B) Western blot analysis of CalDAG-GEFI expression in CalDAG-GEFI−/− (KO), WT, and CalDAG-GEFIΔC1 (ΔC1) platelets. Mutant CalDAG-GEFI was detected at a lower molecular weight due to the deletion of the C1 domain (49 amino acids≈5.5 kDa). (C) Immunofluorescence staining for CalDAG-GEFI in WT and CalDAG-GEFIΔC1 (ΔC1) platelets. Results shown in panels A-C are representative of 3 independent experiments. (D) αIIbβ3 integrin activation (JON/A-PE binding) was determined in WT (solid bars), CalDAG-GEFI−/− (KO, checkered), CalDAG-GEFIΔC1 (ΔC1, vertically striped), or CalDAG-GEFI+/− (HET, horizontally striped) platelets activated with PAR4 peptide (1mM, top) or convulxin (Cvx, 750 ng/mL, bottom) in the presence of the P2Y12 inhibitor, 2-MesAMP. n = 6, 3 independent experiments.
Figure 7
Figure 7
Thrombosis and hemostasis in mice expressing CalDAG-GEFIΔC1 in circulating blood cells. (A-B) Platelet adhesion to collagen at 400 s−1 (A) or 2000 s−1 (B). (Top) Representative images (KO: CalDAG-GEFI−/−, ΔC1: CalDAG-GEFIΔC1). All images were obtained on a Nikon Eclipse Ti-U inverted microscope (Nikon) equipped with a Retiga EXL monochrome camera (QImaging) and the Nikon NIS Elements software (NIS-Elements Advanced Research). (Bottom)Thrombosis score (fluorescence intensity multiplied with area coverage after 5 minutes of perfusion) for the indicated genotypes (WT: wild-type; HET: CalDAG-GEFI+/−; KO: CalDAG-GEFI−/−; ΔC1: CalDAG-GEFIΔC1 chimera). n = 5-6, 3 independent experiments. (C) Bleeding time and blood loss volume determined in WT/GFP (circle) or CalDAG-GEFIΔC1/GFP (ΔC1/GFP, square) chimeric mice.

Similar articles

Cited by

References

    1. Ruggeri ZM. Platelets in atherothrombosis. Nat Med. 2002;8(11):1227–1234. - PubMed
    1. Alexander JH. The current state of antiplatelet therapy in acute coronary syndromes: the data and the real world. Cleve Clin J Med. 2009;76(suppl 1):S16–23. - PubMed
    1. Michelson AD. Antiplatelet therapies for the treatment of cardiovascular disease. Nat Rev Drug Discov. 2010;9(2):154–169. - PubMed
    1. Coller BS, Shattil SJ. The GPIIb/IIIa (integrin alphaIIbbeta3) odyssey: a technology-driven saga of a receptor with twists, turns, and even a bend. Blood. 2008;112(8):3011–3025. - PMC - PubMed
    1. Hynes RO. Integrins: bidirectional, allosteric signaling machines. Cell. 2002;110(6):673–687. - PubMed

Publication types

MeSH terms