. 2011 Jan 6;117(1):156-64.
doi: 10.1182/blood-2010-01-262808. Epub 2010 Oct 22.

Homoharringtonine reduced Mcl-1 expression and induced apoptosis in chronic lymphocytic leukemia

Affiliations

Homoharringtonine reduced Mcl-1 expression and induced apoptosis in chronic lymphocytic leukemia

Rong Chen et al. Blood. .

Abstract

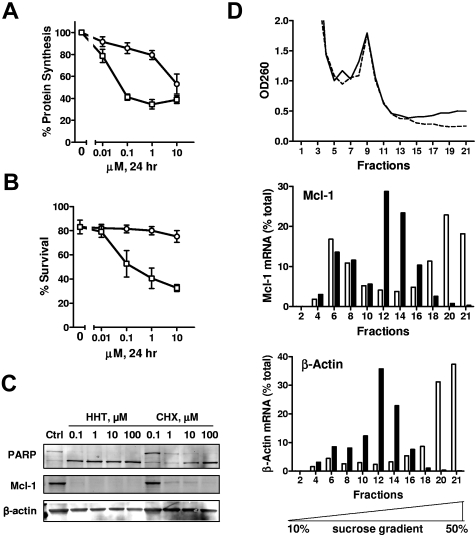
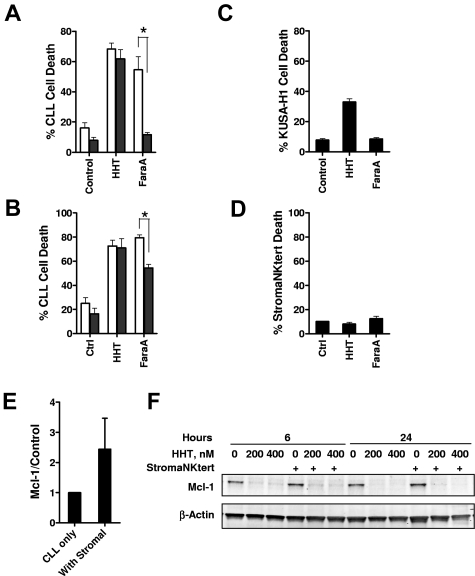
Homoharringtonine (HHT) is a plant alkaloid that inhibits the elongation phase of translation that is currently in clinical trials. Because the intrinsically short-lived antiapoptotic protein myeloid cell leukemia-1 (Mcl-1) has been reported to support the survival of chronic lymphocytic leukemia (CLL) cells, we hypothesized that inhibition of protein synthesis by HHT would decrease Mcl-1 expression and induce apoptosis in CLL. In primary CLL cells, HHT induced significant apoptosis independent of the prognostic characteristics of the patients. This was associated with inhibition of translation and decreased Mcl-1 levels in CLL cells. Mcl-1 reduction was evident as early as 2 hours and continued to decrease in the next 6-8 hours, whereas cell death started in 2 hours and continued to increase for 24 hours. Reduction of the Mcl-1 level was due to translation inhibition and proteasome degradation rather than to transcription inhibition or caspase cleavage. HHT and the transcription inhibitor SNS-032 induced synergistic cell killing. Although stromal cells induced Mcl-1 expression and protected CLL cells from the toxicity of fludarabine, this induction was reversed by HHT, which overcame stromal cell-mediated protection. Thus, these results provide a rationale for clinical development of HHT in CLL as single agent or in combinations.


Figures

Figure 1
Figure 1
HHT induced apoptosis in CLL cells. (A) HHT induced apoptosis in CLL cells in a time- and concentration-dependent manner. CLL cells were incubated with 0nM (○), 50nM (□), 100nM (▵), 200nM (□), or 400nM (◇) HHT for 6, 12, or 24 hours (left). Apoptosis was detected by annexin V–PI double staining and quantitated by flow cytometric analysis. Each concentration represents the mean ± SEM of 8 patient samples. HHT induced apoptosis in CLL cells with an IC50 of 105nM at 24 hours (right). CLL cells were incubated with various concentrations of HHT for 24 hours. Each data point represents the mean ± SEM of 28 patient samples. (B) HHT (100nM) induced significant apoptosis in CLL cells at 24 hours (P < .0001, paired t test). CLL cells from 51 patients were mock-incubated or with 100nM HHT for 24 hours, and apoptosis was detected by annexin V–PI staining. Bars indicate medium values of each group; 17.5% cell death for the control group and 59.9% for the HHT-treated group. (C) HHT induced similar cell death regardless of patient characteristics and treatment history. Cell death induced by 100nM HHT after 24-our incubation was compared in CLL cells from patients with poor (□) or favorable (▩) prognostic factors. A P ≤ .05 from an unpaired t test was considered significant. Induced cell death was the difference of cell death between HHT-treated samples and that of time-matched controls. Each data point represents the mean ± SEM. (D) HHT-induced apoptosis required the continuous presence of HHT. CLL cells were incubated with 200nM HHT (□) for 6, 12, or 24 hours and compared with control (○). At 6 hours, a portion of the culture was washed into drug-free medium (▵). Apoptosis was detected by annexin V–PI staining. Each data point represents the mean ± SEM of 4 patient samples. (E) HHT induced loss of mitochondrial transmembrane potential. CLL cells were incubated with 100nM HHT for 24 hours. Mitochondrial transmembrane potential and viability were measured by DiOC6(3) and PI double staining. Representative figures from 3 independent experiments were shown.
Figure 2
Figure 2
HHT induced down-regulation of Mcl-1. (A) HHT induced down-regulation of Mcl-1 protein levels. CLL cells were incubated with 50, 100, 200, or 400nM HHT for 12 or 24 hours, when the cells were collected and lysed. Proteins such as PARP, Mcl-1, XIAP, and Bcl-2 were analyzed by immunoblotting. β-Actin was used as a loading control; * indicates nonspecific binding. (B) The down-regulation of Mcl-1 by HHT was significant in multiple samples. The Mcl-1 protein levels (mean ± SEM) were normalized to β-actin and quantitated in 5 (0.1μM HHT) and 3 (1μM HHT) patient samples. (C) Time course of HHT-induced reduction of Mcl-1 protein and apoptosis. CLL cells were incubated with HHT for 24 hours. Mcl-1 level (■) was quantitated by immunoblotting (n = 2) and cell death (●) was measured by annexin/PI every 2 hours (n = 6). (D) Sensitivity of CLL cells to HHT correlated with the basal Mcl-1 expression in each patient sample. Seven CLL samples were incubated with increasing concentrations of HHT for 24 hours. Cell death was measured by annexin/PI after 24 hours and correlated to basal Mcl-1 levels, quantitated by immunoblotting.
Figure 3
Figure 3
HHT inhibited protein synthesis. (A) HHT was a more potent inhibitor of protein synthesis than CHX. CLL cells were incubated with 0.1, 1, 10, or 100μM HHT (□) or CHX (○) for 24 hours. Then, 1 μCi/mL (3.7 × 10⁷ Bq/L) [3H]leucine was added to the culture for 1 hour, and radioactivity was determined by liquid scintillation counting (A). Apoptosis was detected by annexin V–PI staining (B). Each data point represents the mean ± SEM of 3 patient samples. Concentration-dependent PARP cleavage and loss of Mcl-1 were detected by immunoblotting (C). (D) Polysomal profiling analysis of CLL cells treated with HHT. CLL cells were incubated in HHT for 2 hours before lysed and resolved on a 10%-50% sucrose gradient. Twenty-two fractions were collected from each sample. The absorbance at 260 nm (OD260) was presented in the top panel. Solid line indicates control; dashed line, HHT treated. Mcl-1 and β-actin mRNA were quantitated in every other fraction and presented as percentage of total in all fractions. The analysis was repeated in 3 CLL samples with similar results. Results from one representative CLL sample were shown. Open bars indicate controls; solid bars, treatment with 200nM HHT.
Figure 4
Figure 4
HHT did not inhibit transcription and was synergistic with SNS-032. (A) HHT did not inhibit transcription as did SNS-032. CLL cells were incubated with 0.1, 0.2, or 1μM HHT (●) or with 0.3 or 1μM SNS-032 (■) for 24 hours. The mRNA levels of Mcl-1 were measured by real-time RT-PCR, each performed in duplicate, and compared with time-matched controls. The 18s RNA was used as normalize for loading. Each data point represents the mean ± SEM of 3 patient samples. (B) HHT was synergistic with SNS-032 in killing CLL cells. CLL cells were incubated with 25, 50, 75, 100, 125, or 150nM HHT for 24 hours with 50, 100, 150, 200, 250, or 300nM SNS-032 or with a combination of HHT and SNS-032 at a ratio of 1:2. Apoptosis was detected by annexin V–PI staining. Each data point represents the mean of 4 patient samples. The combination index was calculated by CalcuSyn with the use of the median effect method. (C) Combination of HHT and SNS-032 deplete more Mcl-1 than single drug alone. CLL cells were incubated with 100nM SNS-032 or 50nM HHT alone or in combination. PARP and Mcl-1 proteins were analyzed by immunoblotting. Cell death was measured by annexin/PI staining. Expected cell death was calculated as described in “Methods.” Two representative results from 4 CLL samples were shown. Ctrl indicates control; SNS, SNS-032; S+H, combination of SNS-032 and HHT.
Figure 5
Figure 5
HHT-induced Mcl-1 down-regulation was largely because of proteasome degradation. (A) HHT-induced Mcl-1 down-regulation was not a result of caspase-3 cleavage. CLL cells were incubated with 0.1 or 1μM HHT for 24 hours with or without the addition of 100μM Z-VAD-FMK. PARP and Mcl-1 proteins were analyzed by immunoblotting. (B) Apoptosis was detected by annexin V–PI staining. Each data point represents the mean ± SEM of 4 patient samples; □ indicates HHT only; ■, HHT with 100μM Z-VAD-FMK. (C) HHT-induced Mcl-1 down-regulation was largely because of proteasome degradation. CLL cells were incubated with 0.1 or 1μM HHT for 24 hours with or without the addition of 10μM MG-132. PARP and Mcl-1 proteins were analyzed by immunoblotting.
Figure 6
Figure 6
The stromal cells did not protect CLL cells from HHT-induced apoptosis. (A) CLL cells were incubated with 100nM HHT or 10μM F-ara-A (fludarabine (9-β-D-arabinofuranosyl-2-fluoroadenine)) for 24 hours at the absence (□) or presence ■) of the (A) murine stromal cell line KUSA-H1 (n = 3) or the (B) human stromal cell line StromaNKtert (n = 4). Cell death was measured by annexin V–PI staining. Toxicity of HHT to the KUSA-H1 (C) or StromaNKtert (D) was measured by incubating the stromal cells with HHT or F-ara-A for 24 hours before the cells were trypsinized for cell death measurement by annexin V–PI staining. *Difference was significant, P ≤ .05. (E) Incubating of CLL cells with stromal cells induced Mcl-1 expression. CLL cells were incubated with StromaNKtert cells for 24 hours, and Mcl-1 level was measured by immunoblotting. Data (mean ± SEM) represent the average of 4 CLL samples. (F) Reducing Mcl-1 level by HHT was not affected by stromal cells. CLL cells were incubated at the presence or absence of StromaNKtert cells for 24 hours before exposure to 200 and 400nM HHT for 6 and 24 hours. Mcl-1 levels were analyzed by immunoblotting. Data showed 1 of 4 CLL samples with similar results.

Similar articles

Cited by

References

    1. Tam CS, O'Brien S, Wierda W, et al. Long-term results of the fludarabine, cyclophosphamide, and rituximab regimen as initial therapy of chronic lymphocytic leukemia. Blood. 2008;112(4):975–980. - PMC - PubMed
    1. Robertson LE, Plunkett W, McConnell K, Keating MJ, McDonnell TJ. Bcl-2 expression in chronic lymphocytic leukemia and its correlation with the induction of apoptosis and clinical outcome. Leukemia. 1996;10(3):456–459. - PubMed
    1. Pepper C, Lin TT, Pratt G, et al. Mcl-1 expression has in vitro and in vivo significance in chronic lymphocytic leukemia and is associated with other poor prognostic markers. Blood. 2008;112(9):3807–3817. - PubMed
    1. Willis SN, Chen L, Dewson G, et al. Proapoptotic Bak is sequestered by Mcl-1 and Bcl-xL, but not Bcl-2, until displaced by BH3-only proteins. Genes Dev. 2005;19(11):1294–1305. - PMC - PubMed
    1. Longo PG, Laurenti L, Gobessi S, et al. The Akt/Mcl-1 pathway plays a prominent role in mediating antiapoptotic signals downstream of the B-cell receptor in chronic lymphocytic leukemia B cells. Blood. 2008;111(2):846–855. - PubMed

Publication types

MeSH terms

Substances