

P-selectin glycoprotein ligand-1 deficiency is protective against obesity-related insulin resistance
- PMID: 20971965
- PMCID: PMC3012171
- DOI: 10.2337/db09-1894
P-selectin glycoprotein ligand-1 deficiency is protective against obesity-related insulin resistance
Abstract
Objective: An inflammatory process is involved in the mechanism of obesity-related insulin resistance. Recent studies indicate that monocyte chemoattractant protein-1 (MCP-1) is a major chemokine that promotes monocyte infiltration into adipose tissues; however, the adhesion pathway in adipose tissues remains unclear. We aimed to clarify the adhesion molecules that mediate monocyte infiltration into adipose tissue.
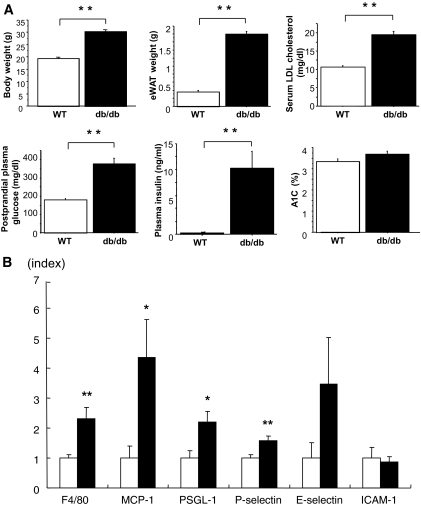
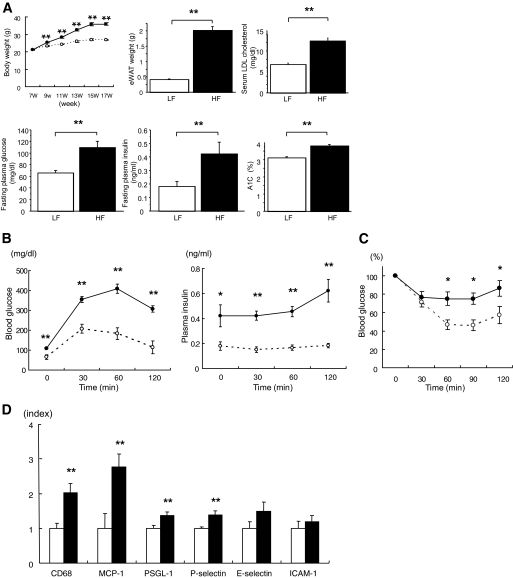
Research design and methods: We used a DNA microarray to compare the gene expression profiles in epididymal white adipose tissues (eWAT) between db/db mice and C57/BL6 mice each fed a high-fat diet (HFD) or a low-fat diet (LFD). We investigated the change of insulin resistance and inflammation in eWAT in P-selectin glycoprotein ligand-1 (PSGL-1) homozygous knockout (PSGL-1⁻(/)⁻) mice compared with wild-type (WT) mice fed HFD.
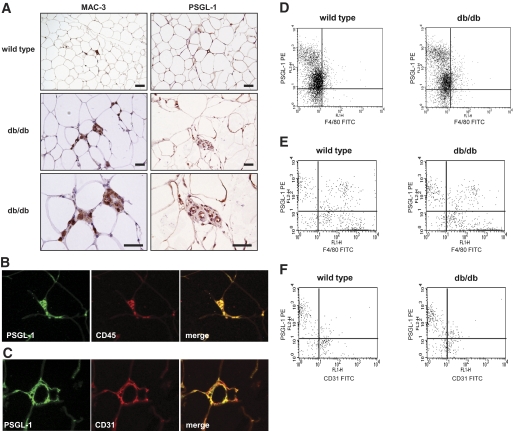
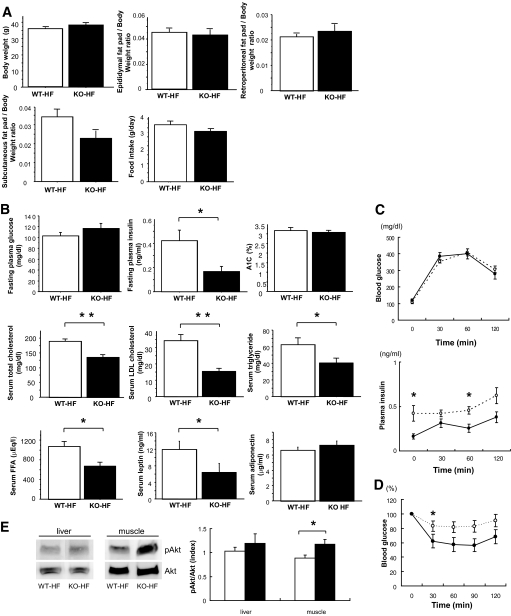
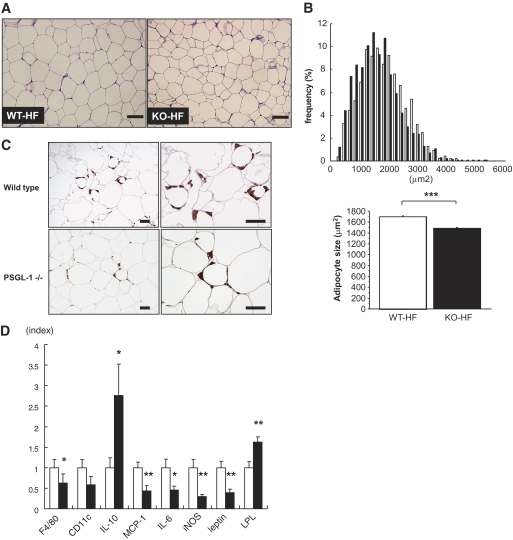
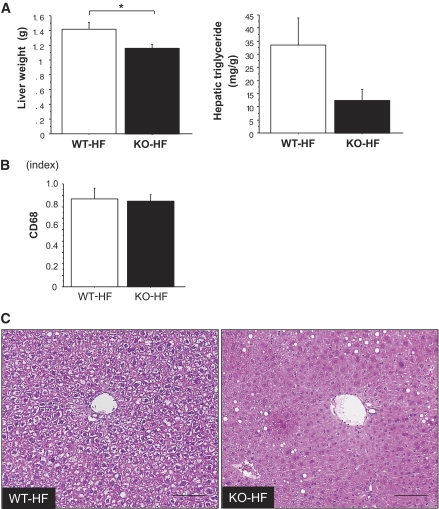
Results: DNA microarray analysis revealed that PSGL-1, a major ligand for selectins, is upregulated in eWAT from both db/db mice and WT mice fed HFD. Quantitative real-time RT-PCR and immunohistochemistry showed that PSGL-1 is expressed on both endothelial cells and macrophages in eWAT of obese mice. PSGL-1⁻(/)⁻ mice fed HFD showed a remarkable reduction of macrophage accumulation and expression of proinflammatory genes, including MCP-1 in eWAT. Moreover, adipocyte hypertrophy, insulin resistance, lipid metabolism, and hepatic fatty change were improved in PSGL-1⁻(/) ⁻mice compared with WT mice fed HFD.
Conclusions: These results indicate that PSGL-1 is a crucial adhesion molecule for the recruitment of monocytes into adipose tissues in obese mice, making it a candidate for a novel therapeutic target for the prevention of obesity-related insulin resistance.
Figures
Similar articles
-
P-selectin glycoprotein ligand-1 regulates adhesive properties of the endothelium and leukocyte trafficking into adipose tissue.Circ Res. 2010 Aug 6;107(3):388-97. doi: 10.1161/CIRCRESAHA.110.218651. Epub 2010 Jun 17. Circ Res. 2010. PMID: 20558823 Free PMC article.
-
Osteopontin deletion prevents the development of obesity and hepatic steatosis via impaired adipose tissue matrix remodeling and reduced inflammation and fibrosis in adipose tissue and liver in mice.PLoS One. 2014 May 28;9(5):e98398. doi: 10.1371/journal.pone.0098398. eCollection 2014. PLoS One. 2014. PMID: 24871103 Free PMC article.
-
TREM2 regulates obesity-induced insulin resistance via adipose tissue remodeling in mice of high-fat feeding.J Transl Med. 2019 Sep 2;17(1):300. doi: 10.1186/s12967-019-2050-9. J Transl Med. 2019. PMID: 31477129 Free PMC article.
-
PSGL-1, a Strategic Biomarker for Pathological Conditions in HIV Infection: A Hypothesis Review.Viruses. 2023 Oct 31;15(11):2197. doi: 10.3390/v15112197. Viruses. 2023. PMID: 38005875 Free PMC article. Review.
-
P-Selectin Glycoprotein Ligand 1: A Potential HIV-1 Therapeutic Target.Front Immunol. 2021 Aug 9;12:710121. doi: 10.3389/fimmu.2021.710121. eCollection 2021. Front Immunol. 2021. PMID: 34434194 Free PMC article. Review.
Cited by
-
Glycopeptide analogues of PSGL-1 inhibit P-selectin in vitro and in vivo.Nat Commun. 2015 Mar 31;6:6387. doi: 10.1038/ncomms7387. Nat Commun. 2015. PMID: 25824568 Free PMC article.
-
Diabetes mellitus and diabetic nephropathy: a review of the literature on hemostatic changes in coagulation and thrombosis.Blood Res. 2022 Jun 30;57(2):101-105. doi: 10.5045/br.2022.2021204. Epub 2022 May 30. Blood Res. 2022. PMID: 35620906 Free PMC article. Review.
-
Glycosphingolipid modification: structural diversity, functional and mechanistic integration of diabetes.Diabetes Metab J. 2011 Aug;35(4):309-16. doi: 10.4093/dmj.2011.35.4.309. Epub 2011 Aug 31. Diabetes Metab J. 2011. PMID: 21977449 Free PMC article.
-
β3-Adrenergic receptor stimulation induces E-selectin-mediated adipose tissue inflammation.J Biol Chem. 2013 Jan 25;288(4):2882-92. doi: 10.1074/jbc.M112.412346. Epub 2012 Dec 12. J Biol Chem. 2013. PMID: 23235150 Free PMC article.
-
Tissue-Specific and Genetic Regulation of Insulin Sensitivity-Associated Transcripts in African Americans.J Clin Endocrinol Metab. 2016 Apr;101(4):1455-68. doi: 10.1210/jc.2015-3336. Epub 2016 Jan 20. J Clin Endocrinol Metab. 2016. PMID: 26789776 Free PMC article.
References
-
- Hotamisligil GS, Shargill NS, Spiegelman BM: Adipose expression of tumor necrosis factor-alpha: direct role in obesity-linked insulin resistance. Science 1993;259:87–91 - PubMed
-
- Takahashi K, Mizuarai S, Araki H, Mashiko S, Ishihara A, Kanatani A, Itadani H, Kotani H: Adiposity elevates plasma MCP-1 levels leading to the increased CD11b-positive monocytes in mice. J Biol Chem 2003;278:46654–46660 - PubMed
Publication types
MeSH terms
Substances
LinkOut - more resources
Full Text Sources
Medical
Molecular Biology Databases
Research Materials
Miscellaneous
