. 2011 Jan;60(1):239-47.
doi: 10.2337/db10-0573. Epub 2010 Oct 22.

Production of functional glucagon-secreting α-cells from human embryonic stem cells

Affiliations

Production of functional glucagon-secreting α-cells from human embryonic stem cells

Alireza Rezania et al. Diabetes. 2011 Jan.

Abstract

Objective: Differentiation of human embryonic stem (hES) cells to fully developed cell types holds great therapeutic promise. Despite significant progress, the conversion of hES cells to stable, fully differentiated endocrine cells that exhibit physiologically regulated hormone secretion has not yet been achieved. Here we describe an efficient differentiation protocol for the in vitro conversion of hES cells to functional glucagon-producing α- cells.

Research design and methods: Using a combination of small molecule screening and empirical testing, we developed a six-stage differentiation protocol for creating functional α-cells. An extensive in vitro and in vivo characterization of the differentiated cells was performed.

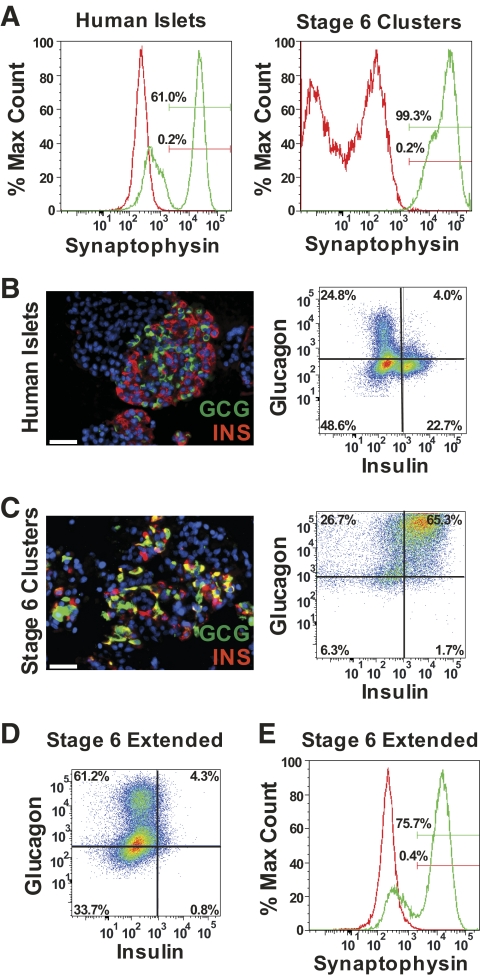
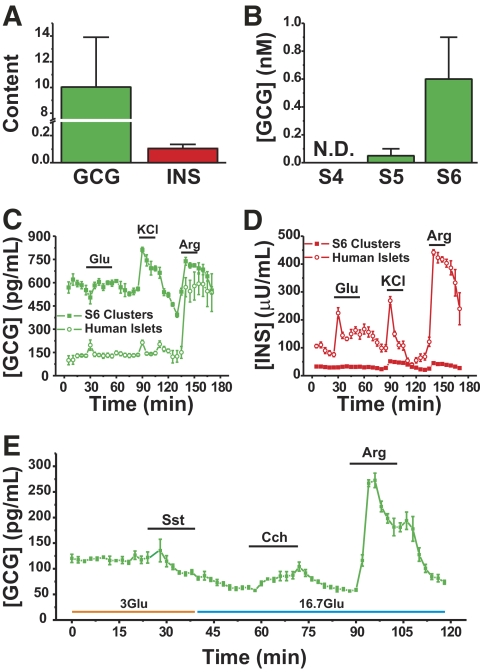
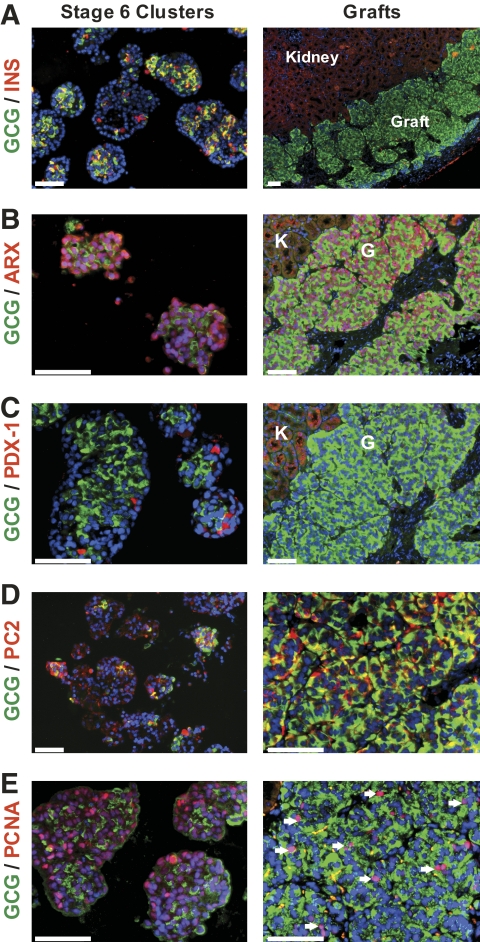
Results: A high rate of synaptophysin expression (>75%) and robust expression of glucagon and the α-cell transcription factor ARX was achieved. After a transient polyhormonal state in which cells coexpress glucagon and insulin, maturation in vitro or in vivo resulted in depletion of insulin and other β-cell markers with concomitant enrichment of α-cell markers. After transplantation, these cells secreted fully processed, biologically active glucagon in response to physiologic stimuli including prolonged fasting and amino acid challenge. Moreover, glucagon release from transplanted cells was sufficient to reduce demand for pancreatic glucagon, resulting in a significant decrease in pancreatic α-cell mass.

Conclusions: These results indicate that fully differentiated pancreatic endocrine cells can be created via stepwise differentiation of hES cells. These cells may serve as a useful screening tool for the identification of compounds that modulate glucagon secretion as well as those that promote the transdifferentiation of α-cells to β-cells.


Figures

FIG. 1.
FIG. 1.
Differentiation of hES cells to maturing endocrine cells. A: Schematic representation of 6-stage differentiation protocol, with media and supplements shown below. B: Representative fluorescence-activated cell sorter analysis of CD184 expression (green line) in hES cells at stage 1 of differentiation protocol; isotype control in red. Percentage values indicate number of cells expressing CD184 in each group. C: GCG and INS expression as measured by qRT-PCR in hES cells at stages 4–6, and in stage 6 clusters before (S6C) and after (S6C EC) an extended 4-week culture period. Data are expressed as fold induction versus human islet control; n = 3 for each stage of differentiation. Error bars indicate SE. D: Representative brightfield images of stage 6 hES cells, Stage 6 clusters, and dithizone-stained human islets. Scale bar, 150 μm. (A high-quality color representation of this figure is available in the online issue.)
FIG. 2.
FIG. 2.
Morphologic characterization of hES cell–derived cells. A: Representative flow analysis of synaptophysin expression in isolated human islets (left) and stage 6 clusters (right). Isotype shown in red. B: Representative glucagon (GCG) and insulin (INS) immunofluorescence images in paraffin-sectioned adult human islets (left) and flow data from dispersed adult human islets (right). GCG immunoreactivity is shown in green and INS immunoreactivity is shown in red. Scale bar, 50 μm. Quadrant gates set using isotype controls (not shown). C: Representative GCG and INS immunofluorescence images in paraffin-sectioned stage 6 clusters (left) and flow data from dispersed stage 6 clusters (right). GCG immunoreactivity is shown in green and INS immunoreactivity is shown in red. Cells expressing both GCG and INS are shown in yellow. Scale bar, 50 μm. Images in B and C include a DAPI nuclear stain (blue). Quadrant gates set using isotype controls (not shown). D: Representative GCG and INS flow data from dispersed stage 6 clusters after an extended 4-week culture period. Quadrant gates set using isotype controls (not shown). E: Representative synaptophysin expression in stage 6 clusters dispersed after an extended 4-week culture period. Isotype shown in red. (A high-quality color representation of this figure is available in the online issue.)
FIG. 3.
FIG. 3.
Hormone content and secretion kinetics of hES cell–derived cells. A: Glucagon and insulin content of stage 6 clusters, normalized for total DNA content and expressed as fold difference over human islets (n = 3 samples for ES-derived cells and n = 8 for human islets). Error bars indicate SE. B: Twenty-four hour bioactive glucagon release from hES cells at indicated differentiation stages (n = 2). N.D., not detected. C and D: Glucagon (C) and insulin (D) secretion from perifused human islets and stage 6 clusters (n = 4 chambers for each) in response to 15 mmol/l glucose (Glu), 30 mmol/l KCl and 15 mmol/l arginine (Arg). E: Glucagon secretion from perifused stage 6 clusters (n = 4 chambers) in response to 3 mmol/l glucose (3Glu) or 16.7 mmol/l (16.7Glu) with or without 1 μmol/l of the somatostatin analog octreotide (Sst), 100 μmol/l carbachol (Cch), or 15 mmol/l arginine (Arg) as indicated. (A high-quality color representation of this figure is available in the online issue.)
FIG. 4.
FIG. 4.
Transplantation of hES cell–derived cells induces hyperglucagonemia and glucagon intolerance. A: Blood glucose levels after a 4-h morning fast. B: Blood glucose and plasma glucagon levels after an overnight fast and after 45-min refeeding period at 99 days after transplant (Tx). Glucagon was below the level of detection for control and human islet Tx groups (<40 pg/ml). C: Blood glucose and plasma mouse insulin levels (mINS; inset) at day 62 after transplant in response to intraperitoneal arginine injection (2 g/kg). D: Plasma glucagon levels for intraperitoneally arginine test shown in panel C. E: Blood glucose and plasma mouse insulin levels (mINS; inset) after a 4-h morning fast at day 77 after transplant in response to oral glucose challenge (2 g/kg). F: Blood glucose and plasma mouse insulin levels (mINS; inset) at day 92 after transplant in response to intraperitoneal glucagon injection (1 μg/kg). G: Whole body insulin sensitivity was assessed by injecting recombinant human insulin (0.4 units/kg) at day 114 after transplant. H: Plasma immunoreactive glucagon (left) and insulin (right) levels in response to insulin injection shown in panel G. n = 5–7 animals/group; *P < 0.05, **P < 0.01, ***P < 0.001 vs. control; #P < 0.05 vs. respective 0-min time point (Student t test). N.D., not detected. (A high-quality color representation of this figure is available in the online issue.)
FIG. 5.
FIG. 5.
Gross histology of transplanted hES cell–derived cells. Grafts were harvested from hES cell recipients at day 125 after transplant. A: Representative image of engrafted kidney section after DAB staining for glucagon. Scale bar = 1 mm. B: Representative images of hematoxylin-eosin staining at (left) low and (right) high magnification. Scale bars = 1 mm for low magnification image and 50 μm for high magnification image. C: Representative images of Masson's trichrome staining at (left) low and (right) high magnification. Collagen fibers are stained in blue. Scale bars = 100 μm. In all panels, white dotted line delineates kidney-graft border. (A high-quality color representation of this figure is available in the online issue.)
FIG. 6.
FIG. 6.
The α-cell phenotype is enriched after in vivo transplantation. Double immunofluorescence was performed on pretransplant stage 6 clusters and grafts collected 125 days after transplantation. Representative images are shown. A: Insulin (INS; red) expression is largely lost after transplantation whereas glucagon (GCG; green) expression predominates. B: GCG (green) and ARX (red) coexpression is maintained in stage 6 hES cell–derived cells before and after transplantation. C: PDX-1 (red) expression is distinct from glucagon (green) expression in stage 6 clusters, and is absent in grafts. D: Coexpression of glucagon (green) and PC2 (red) is increased in retrieved grafts compared with stage 6 clusters. E: Robust PCNA immunoreactivity (red) is observed in many glucagon-positive cells (green) in stage 6 clusters and after transplantation (see arrows). Scale bars, 100 μm. Images include a DAPI nuclear stain (blue). Kidney and graft tissues are denoted by K and G, respectively, in panels B and C. (A high-quality color representation of this figure is available in the online issue.)

References

    1. Alper J: Geron gets green light for human trial of ES cell-derived product. Nat Biotechnol 2009;27:213–214 - PubMed
    1. Borowiak M, Maehr R, Chen S, Chen AE, Tang W, Fox JL, Schreiber SL, Melton DA: Small molecules efficiently direct endodermal differentiation of mouse and human embryonic stem cells. Cell Stem Cell 2009;4:348–358 - PMC - PubMed
    1. D'Amour KA, Agulnick AD, Eliazer S, Kelly OG, Kroon E, Baetge EE: Efficient differentiation of human embryonic stem cells to definitive endoderm. Nat Biotechnol 2005;23:1534–1541 - PubMed
    1. D'Amour KA, Bang AG, Eliazer S, Kelly OG, Agulnick AD, Smart NG, Moorman MA, Kroon E, Carpenter MK, Baetge EE: Production of pancreatic hormone-expressing endocrine cells from human embryonic stem cells. Nat Biotechnol 2006;24:1392–1401 - PubMed
    1. Jiang J, Au M, Lu K, Eshpeter A, Korbutt G, Fisk G, Majumdar AS: Generation of insulin-producing islet-like clusters from human embryonic stem cells. Stem Cells 2007;25:1940–1953 - PubMed

Publication types

MeSH terms